by Rohith Iyer
Published On Jan. 21, 2025
The last several decades have seen the increase of the use of technology and data analytics in the financial markets which have subsequently altered investment approaches. Strategies that were previously reliant on a deep sense of intuition have now been replaced by systematic and data driven approaches. This indeed has caused the rise of quantitative investing, in which models, algorithms and data analysis are employed to aid in making and managing optimal investment decisions.
These quantitative strategies are devoid of the emotional aspect of decision making bias which makes them applicable in a more straightforward, scalable and efficient manner to portfolio management. Such strategies focus on historical and real-time data to identify patterns and opportunities that can be overlooked when using more traditional methodologies. Such a structured approach builds together precision and adaptability in dynamic market conditions (Tao et al. 2021).
We look into the key tools and resources necessary for quantitative investing in this guide. These include backtesting software, programming tools, and educational resources that are necessary for the development, implementation, and assessment of quantitative strategies. This guide has all the necessary information to assist you in managing quantitative investments regardless of whether you are a portfolio manager with experience or a beginner trying out quantitative strategies for the first time.
Backtesting is a necessary stage in quantitative investing as it offers investors the chance to evaluate the performance of strategies using historical data before implementing them in live markets. The tools listed below are popular for their ability to simulate and optimize strategies effectively:
QuantConnect
Cloud-based platform offering free backtesting for a wide range of asset classes, including equities, forex, and cryptocurrencies.
Supports multiple programming languages such as Python and C#.
Integrates with major brokerage accounts, allowing for seamless transition from backtesting to live trading (QuantConnect 2025).
MetaTrader (MT4/MT5)
Widely used in forex and CFD trading markets.
Features a built-in strategy tester for simulating and optimizing trading algorithms.
Offers a user-friendly interface, making it accessible for beginners (AvaTrade 2024).
TradeStation
Comprehensive platform for algorithmic trading and backtesting.
Provides advanced charting tools and a scripting language (EasyLanguage) for developing custom strategies.
Supports multiple asset classes, including equities, options, and futures (TradeStation 2025).
Excel/Google Sheets
Suitable for beginners looking to manually backtest simple strategies.
Provides a cost-effective way to prototype and understand the mechanics of quantitative strategies.
Ideal for small-scale experiments before transitioning to more advanced platforms (Mansa & Kvilhaug 2022).
Tip: Compliance with technical capabilities, investment objectives and preferred asset classes determines the tool to be used for backtesting.
Favorable outcomes for quantitative strategies are highly dependent on high-quality and reliable data. Below are some widely used platforms for obtaining diverse datasets:
Bloomberg Terminal
Mainly for professional investors, offering comprehensive datasets, including price data, financial statements, and real-time news.
Highly expensive but invaluable for institutional and professional use.
Quandl
Provides datasets ranging from historical stock prices to alternative data, such as sentiment analysis and economic indicators.
Offers both free and premium plans with API support for Python and R.
Alpha Vantage
Free API providing historical and real-time data for stocks, forex, and cryptocurrencies.
An excellent choice for beginners experimenting with data-driven strategies.
Yahoo Finance
A free and intuitive platform for downloading stock data.
Suitable for basic analysis, portfolio tracking, and implementing simple strategies like mean reversion.
Tip: Instead of trusting the accuracy of data from only one source it would be better to use several sources and combine their information.
Programming skills are fundamental for developing algorithms, automating strategies, and conducting data analysis in quantitative investing. Below are the most commonly used tools:
Python
A versatile and beginner-friendly programming language widely used in quantitative finance.
Libraries like NumPy, pandas, and PyAlgoTrade simplify tasks like data manipulation and strategy implementation.
R
Specialized for statistical analysis and visualization.
Includes powerful libraries such as quantmod and PerformanceAnalytics, making it popular among data analysts.
MATLAB
A premium tool designed for quantitative modeling and algorithm development.
Offers extensive library support for financial data analysis, making it ideal for advanced users.
Jupyter Notebooks
A tool that combines code, visuals, and documentation in one environment.
Facilitates the development and sharing of strategies with team members or the broader community.
Tip: If you are a complete beginner to programming then a good starting point is with Python due to its ability to support with its vast amount of educational resources.
A mix of theoretical knowledge and practical application is key to mastering quantitative investing. Below are some top resources to enhance your learning:
Books
Quantitative Trading by Ernie Chan: A beginner-friendly introduction to quantitative investing.
Advances in Financial Machine Learning by Marcos Lopez de Prado: A pioneering book that explores the challenges and opportunities of applying machine learning and AI to develop trading strategies (ML Blogger 2023).
Online Courses
Applying Data Analytics in Finance (Coursera): Covers basic trading algorithms and financial data analysis (Coursera 2020).
Algorithmic Trading & Time Series Analysis in Python and R (Udemy): Practical tutorials on building and testing trading algorithms using Python and R programming languages (Udemy 2025).
Forums and Communities
Reddit’s r/quantfinance: Discussions and resources for all levels of experience.
QuantInsti Slack Group: Networking opportunities and expert insights.
Tip: Combine reading with practical experience through coding projects or virtual trading simulations to solidify your understanding.
Efficient execution and portfolio management are crucial for the successful implementation of quantitative strategies. These tools help automate trades, monitor performance, and manage assets effectively:
Interactive Brokers (IBKR)
A robust platform offering an API for algorithmic trading.
Supports global markets and multiple asset classes, including stocks, options, and forex.
Advanced analytics and reporting features suitable for both retail and institutional investors.
eToro
A beginner-friendly platform with unique social trading features.
Allows users to replicate the strategies of successful traders, fostering a collaborative investment environment.
Supports a range of assets, including stocks, cryptocurrencies, and commodities.
Wealthica
Portfolio tracking software designed for retail investors.
Consolidates data from multiple accounts, making it easier to analyze and optimize investments.
Ideal for tracking performance and understanding asset allocation across various platforms.
Alpaca
A commission-free trading API specifically for U.S. stocks.
Built for developers creating custom trading applications or integrating with existing tools.
Offers real-time market data and paper trading accounts for strategy testing.
Tip: Use demo accounts or paper trading features to test execution tools and ensure seamless integration with your strategies before live trading.
To maximize efficiency, it's important to integrate the right tools into a cohesive quantitative investing workflow. Below is a step-by-step guide to streamline your process:
Data Analysis
Source high-quality datasets from platforms like Quandl, Bloomberg Terminal, or Yahoo Finance.
Clean and preprocess data using Python or R packages.
Strategy Development
Develop algorithms and models in Python, MATLAB, or R.
Utilize libraries such as scikit-learn for machine learning or PyAlgoTrade for trading-specific implementations.
Backtesting
Validate strategies using platforms like QuantConnect, MetaTrader, or TradeStation.
Test models against historical data to identify potential risks and optimize performance.
Execution
Automate trades using APIs from Interactive Brokers, Alpaca, or eToro.
Ensure reliability and low latency for high-frequency or algorithmic trading strategies.
Portfolio Management
Track performance and manage risk using tools like Wealthica, Morningstar Direct, or custom dashboards.
Regularly rebalance portfolios to maintain desired asset allocations.
Tip: Document each step of your process using tools like Jupyter Notebooks. This not only aids in tracking your progress but also facilitates iteration and collaboration when refining strategies.
Let’s apply a simple momentum strategy using Python as an example:
This worked example focuses on predicting Intel’s stock prices using historical data from 1980 to 2024. The prediction pipeline involves data preprocessing, exploratory momentum analysis, training an LSTM neural network, and visualizing the results. Here's a step-by-step breakdown:
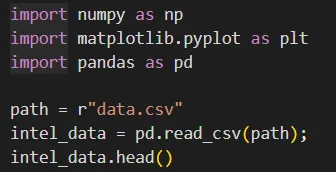
We begin by importing essential Python libraries: numpy, pandas, and matplotlib. The historical stock price data is loaded from a CSV file for analysis.
Here is the output: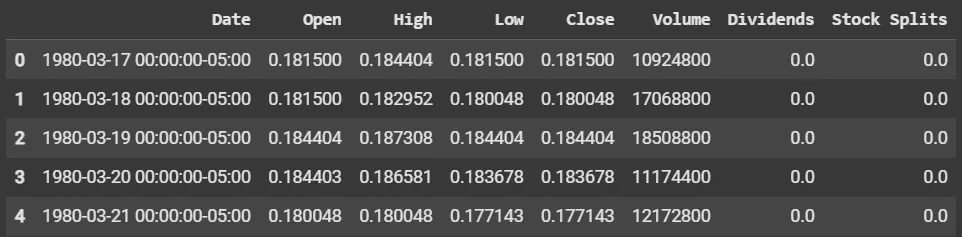
The loaded data contains key columns such as Date, Open, High, Low, Close, and Volume, providing a complete picture of Intel’s trading activity over the years.
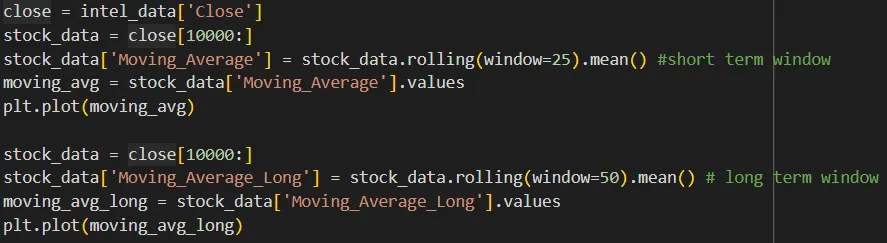
We need to analyze the short-term momentum of the stock by comparing shorter-window moving averages to longer-window moving averages. For the layman, a moving average is just used to "smooth" out the data; a longer-length window for your moving average means your data is smoother, reflects past trends more, and a shorter-length window reflects more recent trends.
To calculate the moving average values for a pandas DataFrame:
Short-Term Moving Average: Reflects recent trends.
Long-Term Moving Average: Smooths out short-term fluctuations for a broader view.
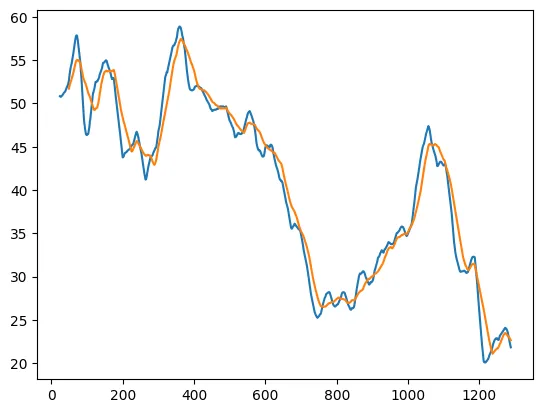
The plotted graph compares short-term (25-day) and long-term (50-day) moving averages. In the blue graph (short-term), there's more noise. But this noise gives us microtrends. For example, at the very end of the graph (this is for the past month or so), Intel's stock price has declined below the moving average. And the rate at which it declined (its slope) is far less than the moving average, so we should have sold the stock at the intersection point.
The dataset is normalized using the MinMaxScaler to transform features into a range of -1 to 1. This step is crucial for efficient neural network training and avoids dominance of larger-scaled features.
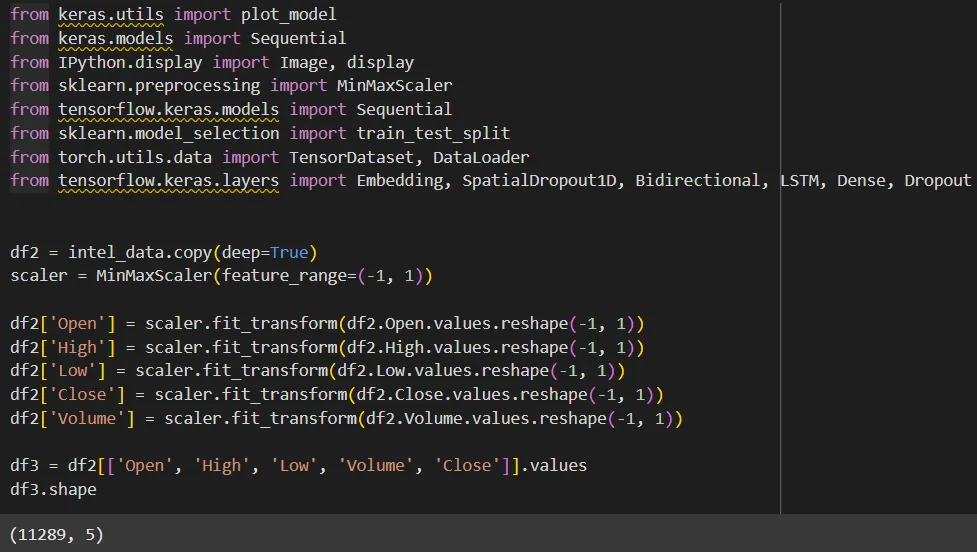
The transformed dataset (df3) is reshaped into sequences of 100 days, preparing it for LSTM model training.
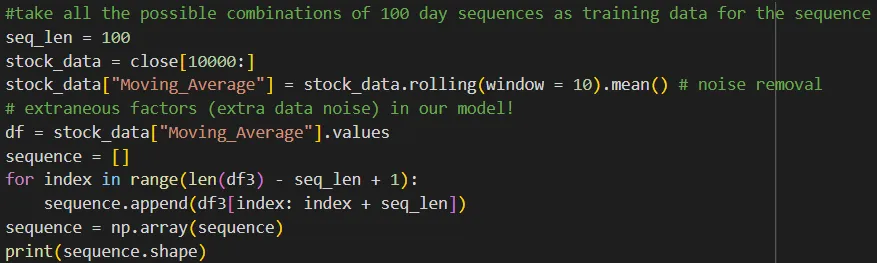
This image demonstrates two main components of data preparation for training the LSTM model:
Code Functionality:
The rolling Moving_Average with a 10-day window is calculated to smooth out extra noise in the data.
A sequence array is built where each sequence includes 100 consecutive data points (seq_len = 100).
The loop appends these 100-day sequences into the sequence list, later converted into a numpy array.
Output:
The resulting shape of the sequence array is (11190, 100, 5), meaning there are 11,190 samples, each with 100 days of data and 5 features (Open, High, Low, Close, Volume).
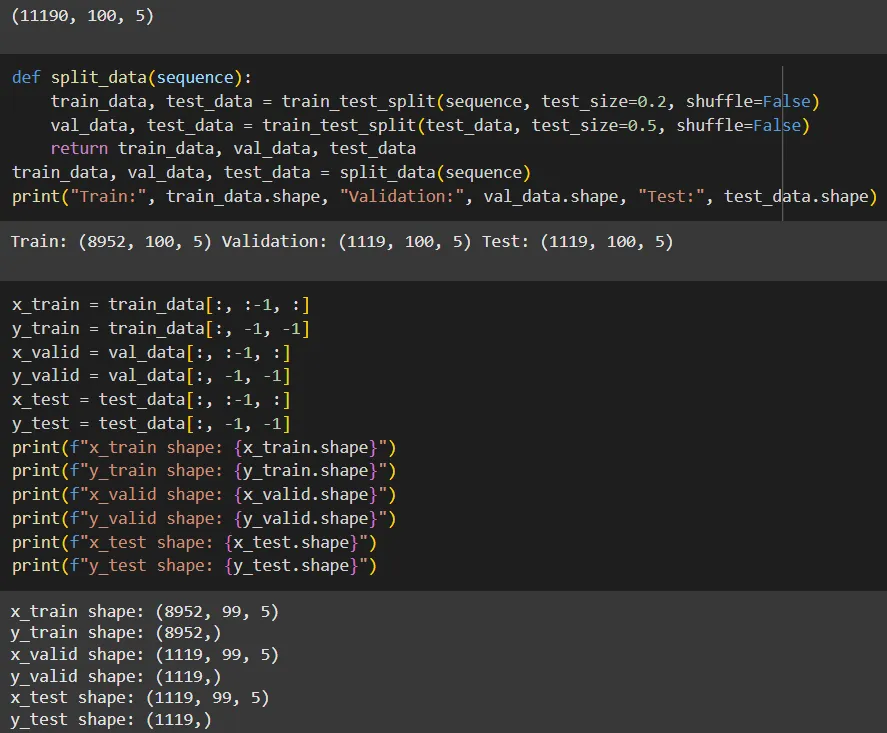
Code Functionality:
The split_data() function uses train_test_split to divide the sequences into:
Training Data
Validation Data
Test Data
This ensures proper data partitioning for training, validating, and testing the model.
Output:
Training data shape: (8952, 99, 5)
Validation data shape: (1119, 99, 5)
Test data shape: (1119, 99, 5)
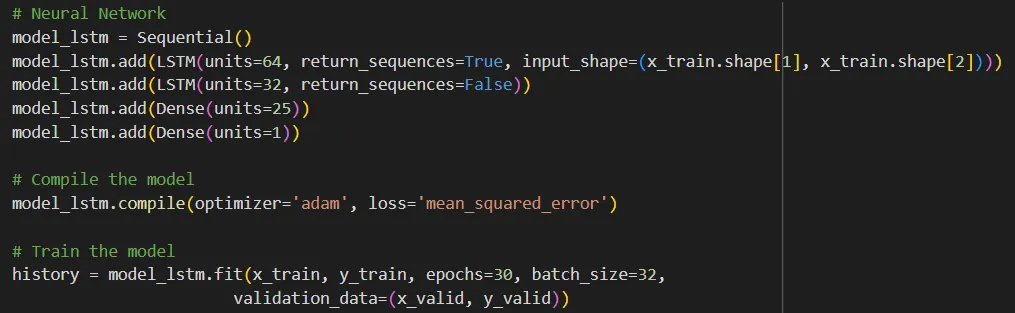
An LSTM (Long Short-Term Memory) network is used for its ability to capture temporal dependencies in time-series data. The model includes two LSTM layers followed by dense layers for output.
The training loss and validation loss decrease steadily, indicating successful learning. Monitoring these metrics helps prevent overfitting. Here is how it works: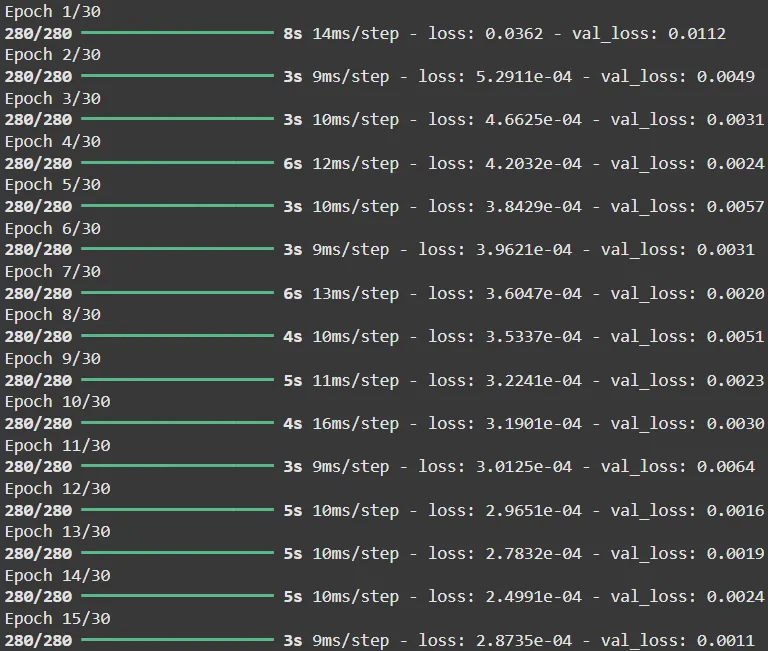

This is to make predictions using the trained LSTM model, evaluating the predictions, and visualizing the results.
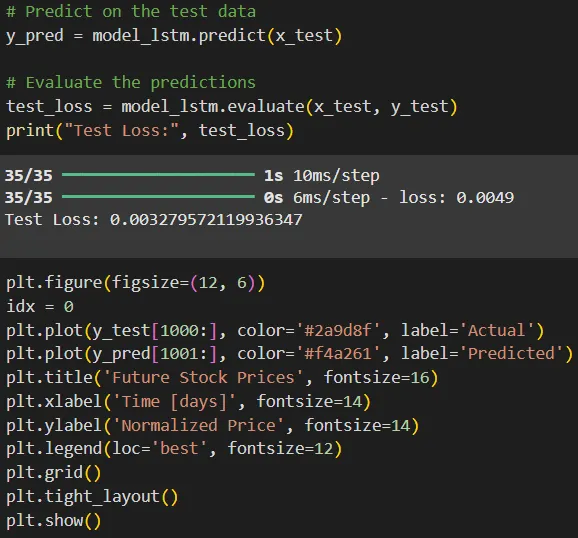
y_pred = model_lstm.predict(x_test):
This uses the trained LSTM model to predict stock prices based on the test dataset (x_test).
test_loss = model_lstm.evaluate(x_test, y_test):
The model's performance is evaluated by calculating the loss between predicted (y_pred) and actual values (y_test).
A low test loss value (e.g., 0.0011) indicates good performance.
plt.plot(y_test[1000:], label='Actual'):
Plots the actual stock prices for the test data (red line).
plt.plot(y_pred[1001:], label='Predicted'):
Plots the model's predicted stock prices (green line).
Graph details:
Title: Future Stock Prices.
Axes:
X-axis: Time (days).
Y-axis: Normalized Price.
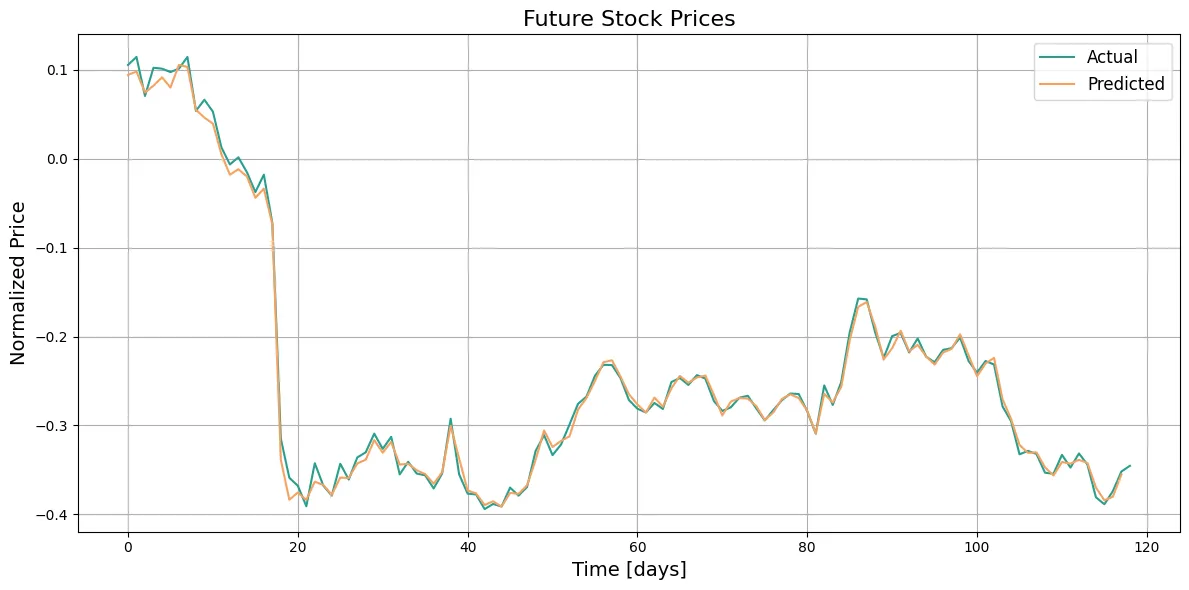
What the Graph Shows:
The red line represents the Actual stock prices over the test period.
The green line represents the Predicted prices generated by the LSTM model.
Both lines align closely, demonstrating that the model successfully captures trends in the stock data.
Key Observations:
The predicted stock prices closely follow the actual values with minor deviations.
This indicates the LSTM's effectiveness in learning time-series patterns from the data.
Using the trained model, we predict Intel’s future stock prices for the next 5 days. Predictions are generated sequentially by sliding the input window forward.
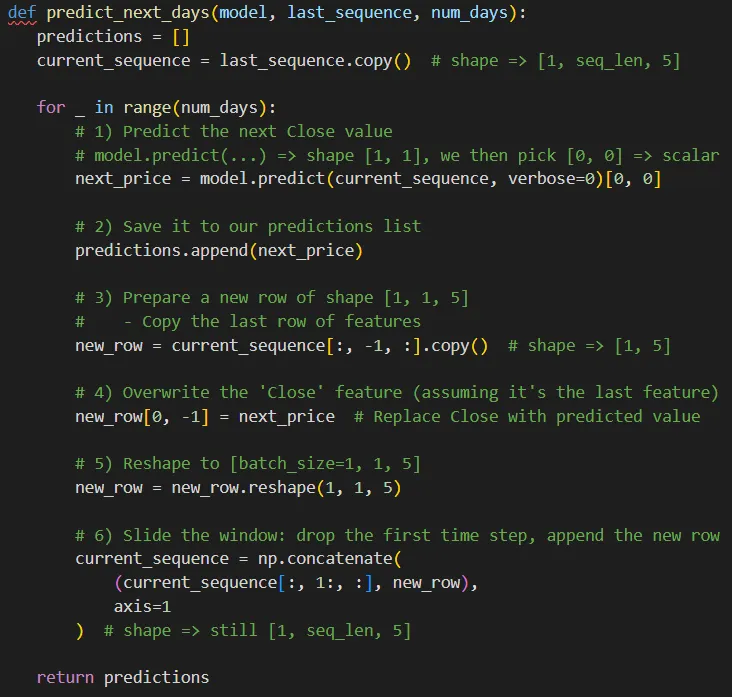
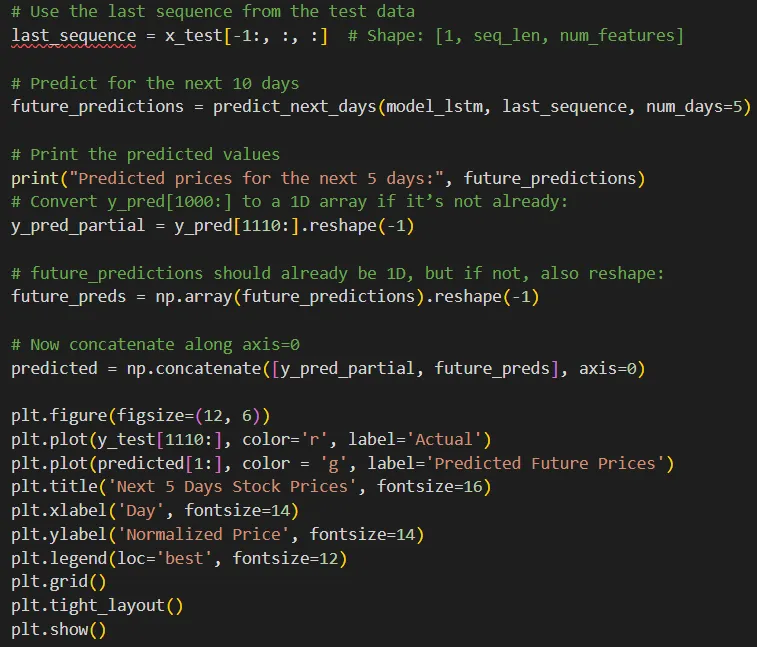
Here, the predict_next_days function slides the window forward by updating the sequence with each predicted price.
Finally, we compare the predicted values with the actual stock prices. This visualization provides insights into the model’s accuracy and reliability.
The graph highlights predicted prices aligning closely with actual prices, demonstrating the model’s performance. For the next 5 days, the normalized prices predict a slight decline.
This project showcases the end-to-end process of predicting stock prices using Python. By leveraging historical data, moving averages, and LSTM neural networks, we achieve a reliable framework for stock price prediction. While the results are promising, further refinements such as hyperparameter tuning and additional features (e.g., macroeconomic indicators) could enhance accuracy.
Interested in trying it out? Here is the link for the code from Google Colab .
Quantitative investing thrives on the effective use of tools and resources. Combinations of backtesting platforms with data and educational providers and execution can turn an amateur to a competent quantitative investor.
Investors can develop a good workflow by using simpler tools like Google Sheets or Alpha Vantage first and then moving on to more complex platforms such as QuantConnect or Interactive Brokers. Education is crucial, as textbooks, courses, and communities will assist you in understanding the fundamentals needed behind quantitative strategies.
You will not be able to comprehend quantitative investing if you do not have the proper tools, so let’s start right from the beginning. Getting started as a quantitative portfolio manager requires you to equip yourself, work hard, and ask questions.
QuantConnect and MetaTrader are great for beginners due to their user-friendly interfaces and extensive tutorials.
While coding enhances your capabilities, beginner-friendly platforms like Excel and eToro require minimal coding knowledge.
Free providers like Alpha Vantage and Yahoo Finance are reliable for basic strategies, but advanced users may prefer premium datasets for accuracy.
Yes, integrating tools like Python for analysis, QuantConnect for backtesting, and Interactive Brokers for execution creates a seamless workflow.
You can start with as little as $500, particularly with tools like fractional shares or commission-free platforms.
Written by Rohith Iyer
Discover investment portfolios that are designed for maximum returns at low risk.
Learn how we choose the right asset mix for your risk profile across all market conditions.
Get weekly market insights and facts right in your inbox

It depicts the actual and verifiable returns generated by the portfolios of SEBI registered entities. Live performance does not include any backtested data or claim and does not guarantee future returns.
By proceeding, you understand that investments are subjected to market risks and agree that returns shown on the platform were not used as an advertisement or promotion to influence your investment decisions.
"I was drawn to Wright Research due to its multi-factor approach. Their Balanced MFT is an excellent product."

By Prashant Sharma
CTO, Zydus
By signing up, you agree to our Terms and Privacy Policy
"I was drawn to Wright Research due to its multi-factor approach. Their Balanced MFT is an excellent product."
By Prashant Sharma
CTO, Zydus
Skip Password
By signing up, you agree to our Terms and Privacy Policy
"I was drawn to Wright Research due to its multi-factor approach. Their Balanced MFT is an excellent product."
By Prashant Sharma
CTO, Zydus
"I was drawn to Wright Research due to its multi-factor approach. Their Balanced MFT is an excellent product."
By Prashant Sharma
CTO, Zydus
Log in with Password →
By logging in, you agree to our Terms and Privacy Policy
"I was drawn to Wright Research due to its multi-factor approach. Their Balanced MFT is an excellent product."
By Prashant Sharma
CTO, Zydus
Log in with OTP →
By logging in, you agree to our Terms and Privacy Policy
"I was drawn to Wright Research due to its multi-factor approach. Their Balanced MFT is an excellent product."
By Prashant Sharma
CTO, Zydus
Answer these questions to get a personalized portfolio or skip to see trending portfolios.
Answer these questions to get a personalized portfolio or skip to see trending portfolios.
(You can choose multiple options)
Answer these questions to get a personalized portfolio or skip to see trending portfolios.
Answer these questions to get a personalized portfolio or skip to see trending portfolios.
Answer these questions to get a personalized portfolio or skip to see trending portfolios.
(You can choose multiple options)
Investor Profile Score
We've tailored Portfolio Management services for your profile.
View Recommended Portfolios Restart


