by Sonam Srivastava
Published On Aug. 25, 2024
The stock market is often driven by the dual forces of greed and fear. Greed compels investors to seek profits, sometimes leading to risky behavior, while fear drives them to avoid losses, often resulting in overly conservative decisions. Fear can trigger panic selling, causing prices to plummet, while greed can lead to speculative buying, driving prices to unsustainable levels. These emotional swings can create opportunities, but they can also lead to costly mistakes.
As Warren Buffett wisely said, “Be fearful when others are greedy, and greedy when others are fearful.”
Recognizing the impact of fear and greed is essential for making rational investment decisions. In this blog, we’ll explore the key indicators that track fear and greed, how to interpret them, and how to use this knowledge to enhance your investment strategy.
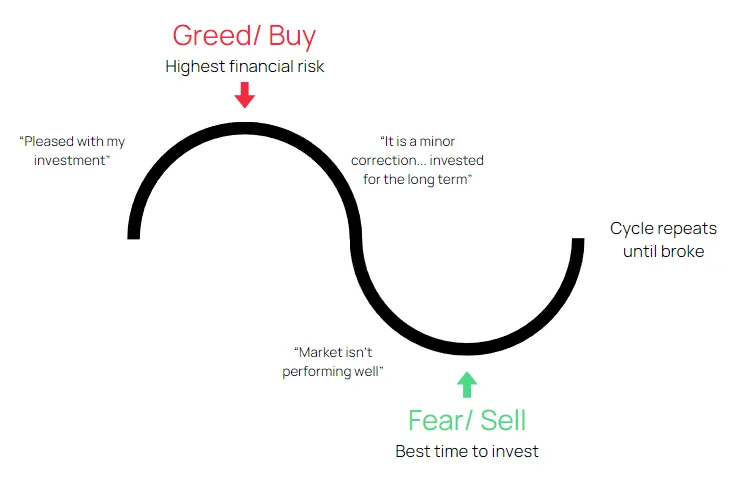
Understanding market sentiment can be a valuable tool for investors looking to navigate the complexities of trading and investing. Various indicators help investors to decode the emotional state of the market and understand how they collectively feel.
Volatility Index (VIX):Often referred to as “fear gauge”, VIX measures expected volatility in the market over the next 30 days. A higher VIX value means greater fear among investors which is often an indicator of increased expected fluctuations. Market sentiment can be gauged by investors through VIX who then changes their strategies on whether fear or complacency dominates the market.
Put-Call Ratio: This ratio compares volume or open interest of put options (rights to sell an asset) and call options (rights to buy an asset). A high put-call ratio indicates a bearish sentiment, as more investors are buying puts in anticipation of a market decline. Conversely, a low ratio suggests bullish sentiment. As extreme values often precede significant market moves, it can imply potential market reversals.
Fear & Greed Index:This index attempts to quantify investor emotions through factors like stock price momentum, junk bond demand and volatility in markets. It provides insight into whether fear or greed is driving the market at any given point in time. Extreme fear can indicate that it may be a good time for buying while extreme greed may signal an impending correction ahead.
A popular tool available with many publications, the fear and greed index helps investors understand the current mood of the stock market. Fear and greed can be quantified on a scale of 0 to 100. Zero means there is extreme fear among investors who become risk-averse and cautious leading to widespread selling. A reading of 100 represents an extreme state of greed characterized by high optimism and a willingness to tolerate significant risks for higher rewards.
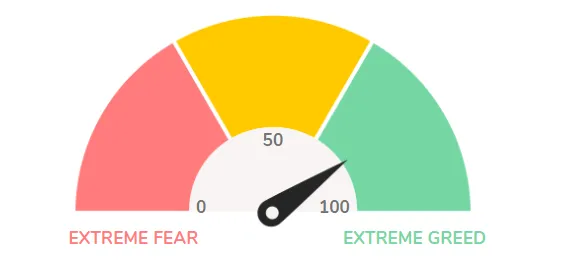
The index consists of seven different stock market indicators that capture various aspects of investor sentiment, including stock price momentum, market volatility and safe-haven demand. These factors are then combined to give an overall score which defines the prevailing sentiments in the market.
Knowing whether fear or greed is driving the markets can be determined through monitoring Fear and Greed Index by investors at any given time. When people see that greed is too much they may want to be prudent or find opportunities when fear abounds. 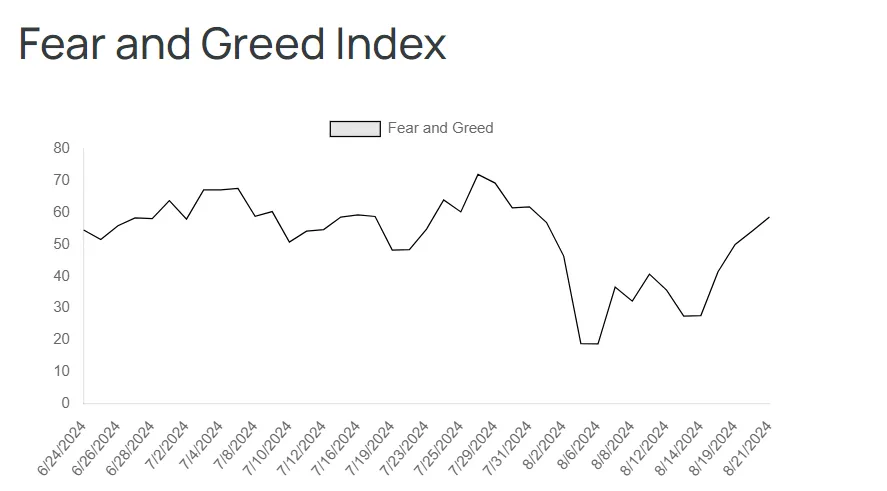
The Fear and Greed Index consists of some significant indicators that each represents a different aspect of market emotions. To understand the mood of the market, these indicators are vital in determining whether fear or greed is currently driving investor behavior. Let us consider these indicators in detail:
Stock Price Momentum refers to the rate at which stock prices are changing, usually measured by the relative strength of the S&P 500 against its 125-day moving average. When prices are well above the average in a strong momentum state it reveals greed as investors bid stocks higher with increasing hopefulness. In weak momentum, however, where prices go below this level there is fear because investors are more wary and start to liquidate their positions.
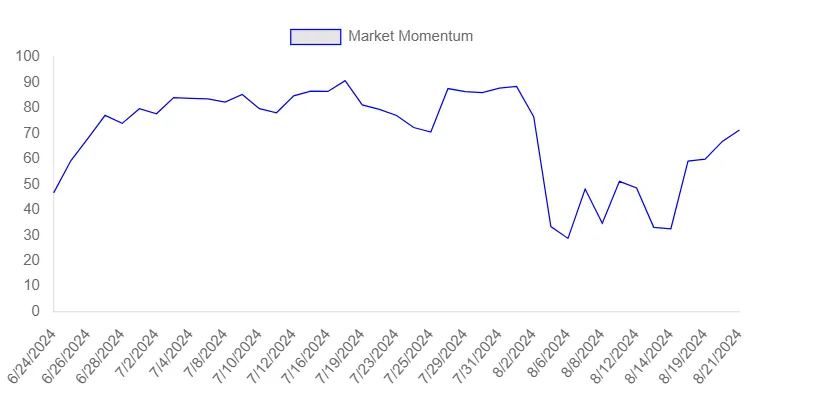
Stock Price Strength compares how many shares are breaking their previous yearly peaks compared with those that have reached new lows over the same period on any given day. Many stocks hitting new highs depict greed which means most people are excited about keeping them for long term purposes since they appreciate greatly. However, if many stocks reach new lows this indicates fear because sellers dominate buyers thereby pushing down prices.
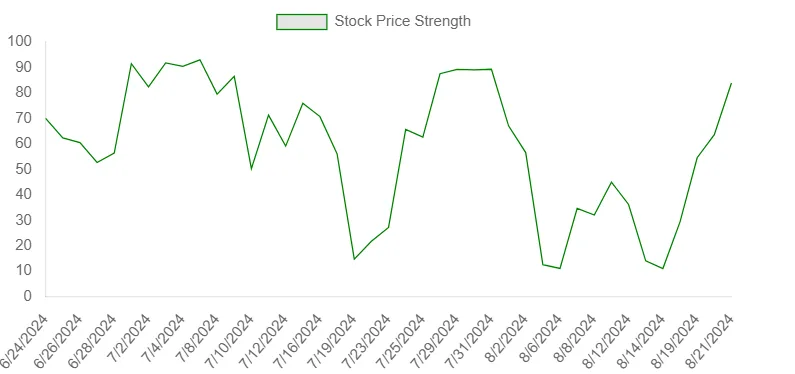
Breadth is defined as the number of shares that are advancing compared to those declining. It measures the overall health and strength of the market. This shows that greedy market sentiment usually occurs when there are a lot of stocks moving higher in a market with strong breadth. On the other hand, investors fear when they see weak breadth in which more stocks are falling than rising hence reducing their market exposure.
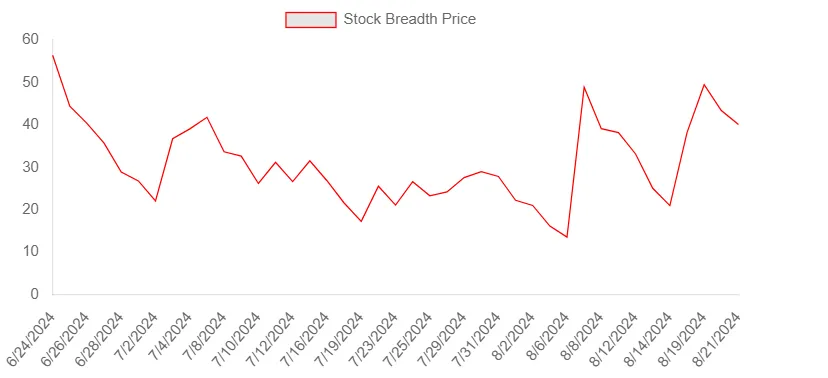
Put and call options are derivatives used by investors to speculate or hedge against stock price movements. The ratio between puts and calls, an important psychological indicator, can be referred to as put/call ratio. If many people buy protection from possible falls, they feel that fear is ruling the markets (a high put/call ratio). Conversely, a low put-call ratio points out that greed rules in this regard; traders believe prices will continue to rise.
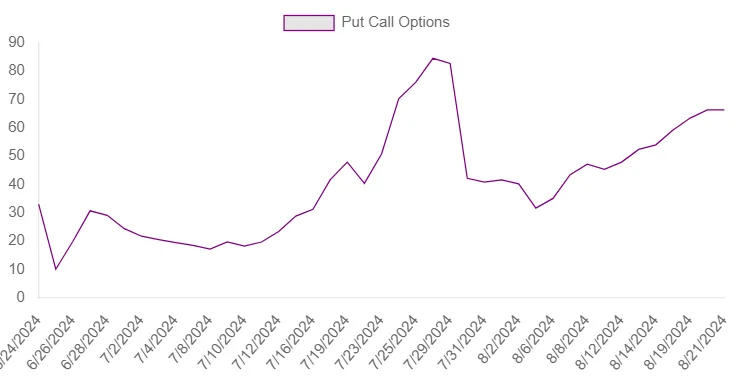
Junk bonds are issued by companies having low credit ratings while high-yield ones have very high risks involved in them. Yield spread between junk bonds and investment-grade bonds is also another key market sentiment indicator. Narrower spread suggests greed, since investors are willing to take on more risk for the expectation of higher returns. Widening spreads can indicate fear, as investors seek the safety of higher-quality bonds and demand greater compensation for holding riskier debt.
The Volatility Index, often referred to as VIX is described as the fear gauge of the market. It’s a measure of short-term expected volatility. A high VIX indicates that investors are scared because they expect major price fluctuations and uncertainty in the market. On the other hand, a low VIX signals complacency or greed among investors who think the market will reach a steady state.
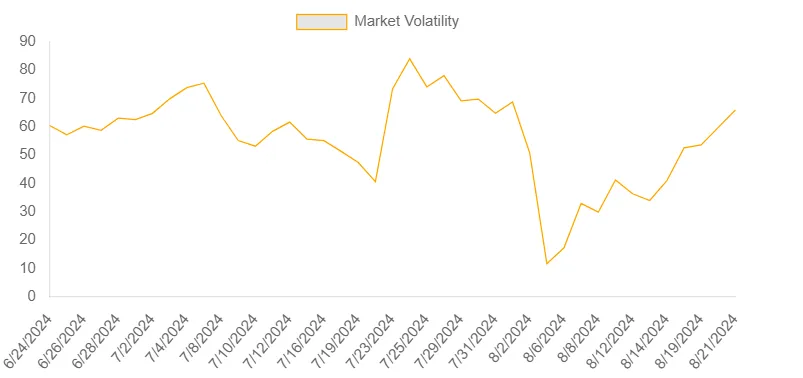
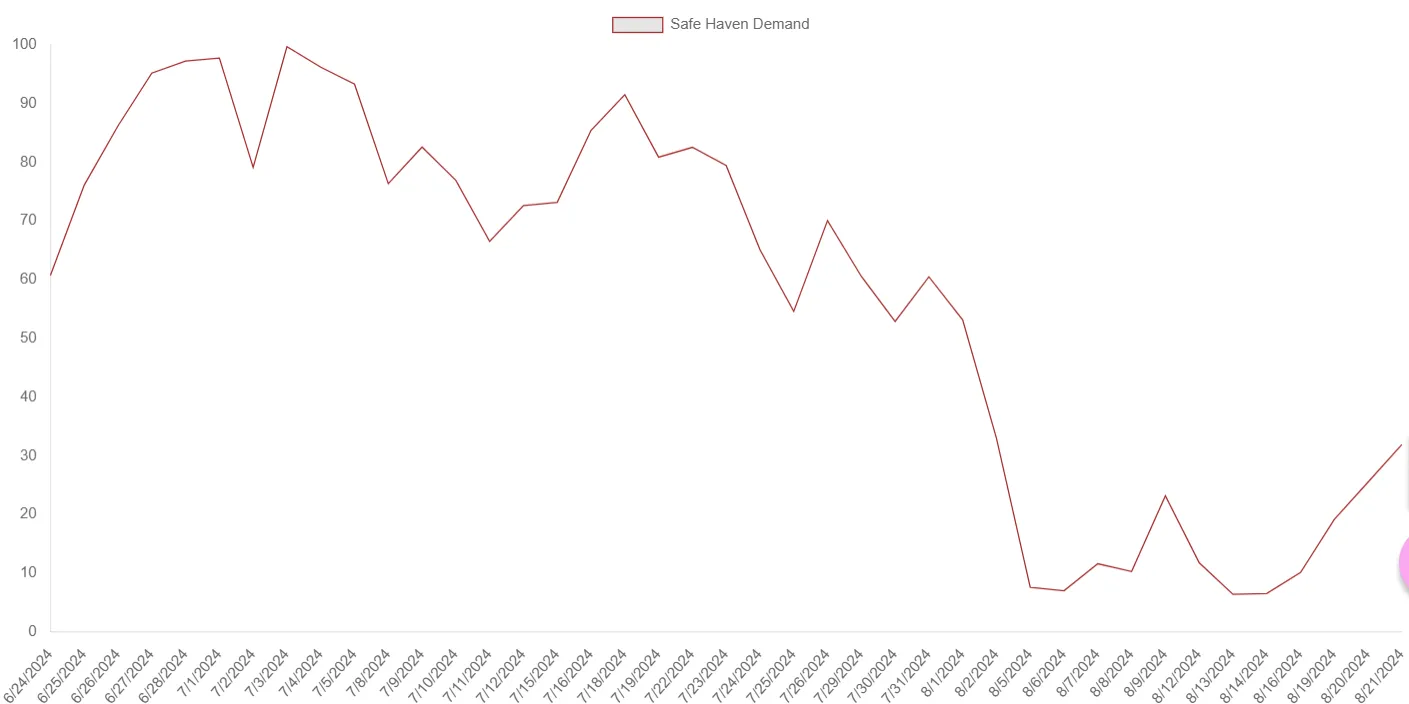
Safe haven demand is an indicator of investor appetite for low-risk, secure investments including government bonds, gold or any other asset perceived to be safe in times of market uncertainty. When the demand for these safe havens goes up it shows fear because investors want to protect their capital from market volatilities. Conversely when there is low demand for safe havens it reflects greediness since investors take more risks by investing in riskier assets hoping for higher returns.
Contrarian investing is based on the belief that when most investors are driven by either fear or greed, chances are high that the market will be mispriced, which creates opportunities for smart investors.
Extreme Fear (Index readings below 20): When there is a great fear, it usually means that panic selling has pushed stocks below their intrinsic values. This is an opportune time for contrarian investors to come in. By purchasing shares during this period, one can potentially get good assets at lower prices in comparison to other periods and thus position themselves to obtain profits from an eventual market recovery. The advice here is “buy when there’s blood in the streets”, famously espoused by Warren Buffet.
Extreme Greed (Index readings above 80): On the other hand, when there is an extreme greed index; it suggests that optimistic investors have taken prices to levels that may not be sustainable. In such cases, contrarian investors might consider cashing out gains, reducing positions or even going short on stocks and so forth. This policy looks forward to capitalizing on too much optimism before it results in a correction or crash. The idea here is “sell when everyone is buying.”
Additionally, the market knowledge is gained through the Fear and Greed Index that helps time when to enter or exit your trades so as to maximize the returns for traders and short-term investors by following the general sentiment of the markets.
Entry Points: Look for high levels of fear in the index, if you want to buy into the market. This will be a good time to buy because prices generally go down when people are afraid. Moreover, there might be a better risk-to-reward ratio at this point. However, it is essential that this signal be verified by other technical and fundamental analyses so that one does not invest in a falling market.
Exit Points: When greed dominates, you should think about quitting or cutting back on your position(s) in order not to lose money. A bubble can form easily when people become greedier with stock markets which could burst eventually. Selling or reducing exposure during such phases may result in profitable trades while avoiding market downturns.
Use it to manage risk & think about readjusting your portfolio’s asset allocation strategy based on the changes we see in the stock market’s behavior.
During Extreme Fear: Thus, in times of the stalk of fear, think about the possibility of safe assets like bonds or cash, which are the alternative assets you could use to safeguard your portfolio from losses. Alternatively, the sectors such as utilities or consumer staples, that are known to do well even when markets are down, could also be considered. The implementation of hedging strategies that include purchasing put options and inverse ETFs, can be an investment shield successfully as well.
During Extreme Greed: When greed is excessive, it is better to lessen the proportion of high-risk stocks, such as growth stocks or betting stocks, in your portfolio. On the contrary, instead of focusing on the growth stocks, investors can invest in value stocks, as well as in the companies that have a dividend policy, or another kind of securities that provide safety and income. Thus, the strategy of maintaining calm and smooth when the euphoria of market goes high, the period of risk adjustment and correction, that is, the capital preservation is ensured.
It should not be used in isolation. It can only be used as a complement to other forms of analysis which provide a wider view and thus allow investors to make informed decisions:
Technical Analysis: Make use of charts and technical indicators (e.g. moving averages, RSI, and MACD) to verify signals from the Fear and Greed Index. For example, should the Fear index exhibit a nadir, and yet a technically bullish reversal persists, then this will be a further impetus for the buying decision.
Fundamental Analysis: This is the task of evaluating the very basis of the market or the stock per se. However, certain stocks may still be a good buy even if the Fear and Greed Index indicate that there is extremely high greed in the market. On the other hand, in times of high fear, the lack of fundamentals would mean the investor should be careful even in the cases when the index indicates buying opportunities.
Macro-Economic Factors: Explore major indicators such as interest rates, inflation, and GDP growth which might shape market sentiment. By comparing the Fear and Greed Index and the macro-economic environment, the index can be used as a guide to see what is the possible direction of the market.
Investment choices are often emotional, when there is a lack of rationality. One of the ways a fear and greed index can help in this regard is by keeping people away from riding emotional rollercoasters.
Stick To Your Guns: Utilize the index scale to the end that you will not deviate from your investment strategy. Take a case like this for an example, predetermined rules can be set in line with the index levels; in that way, one can go from being extremely afraid by increasing their cash holdings or vice versa from extreme greed to having a higher equity exposure, and still remain calm despite market noises.
Don’t follow the herd: This index is giving the advice to not make the same mistakes as the other funders such as copying another investor. As other market players may often be indulged in either the emotion of fear or the reckless attitude, the counter-approach is recommended to make decisions based on critical thinking and an objective data for not inclining toward the emotional ones.
2008 financial crisis, triggered by the collapse of the housing bubble and the failure of major financial institutions, was one of the most severe market downturns in history. Fear gripped the market as investors watched stock prices plummet, leading to widespread panic selling.
Extreme Fear: As the crisis unfolded, the Fear and Greed Index consistently registered readings of extreme fear, often hovering near 0. This reflected the pervasive anxiety in the market as investors feared a total economic collapse.
Market Reaction: The S&P 500 lost nearly 57% of its value from its peak in 2007 to its trough in March 2009, as fear drove massive sell-offs. U.S. households lost approximately 26% of their net worth, equating to about $17 trillion. The crisis also resulted in 7.5 million job losses.
Investment Opportunity: For contrarian investors, the extreme fear readings during the crisis presented a significant buying opportunity. Those who recognized the excessive pessimism and bought into the market during the darkest days were rewarded handsomely in the years that followed. The S&P 500 more than tripled in value from its March 2009 low over the next decade, as the market recovered and eventually entered a prolonged bull market.
The late 1990s were characterized by a frenzy of speculation in internet-based companies, leading to the so-called Dot-Com Bubble. Investors, driven by greed, poured money into technology stocks with little regard for traditional valuation metrics.
Extreme Greed: During the height of the bubble in 1999 and early 2000, the Fear and Greed Index consistently indicated extreme greed, with readings often above 90. This reflected the widespread euphoria and risk-taking among investors who believed that the rapid rise in tech stocks would continue indefinitely.
Market Reaction: The NASDAQ, which was heavily weighted toward technology stocks, soared by nearly 400% between 1995 and its peak in March 2000. However, when the bubble burst, the NASDAQ lost almost 78% of its value - wiping out $5 trillion in market cap, devastating portfolios that were heavily invested in tech stocks.
Missed Warning Signs: Despite the clear warning signs from the Fear and Greed Index, many investors ignored the excessive optimism and continued to buy into the market. Those who failed to heed the signals of extreme greed suffered significant losses when the bubble eventually burst.
COVID-19 pandemic brought unprecedented uncertainty to global markets. In March 2020, as the virus spread rapidly and economies went into lockdown, fear dominated the market, leading to one of the quickest bear markets in history.
Rapid Shift to Extreme Fear: As news of the pandemic spread, the Fear and Greed Index quickly plunged into extreme fear territory. In March 2020, the index reached one of its lowest levels ever recorded, reflecting the widespread panic as investors feared a global economic collapse.
Market Reaction: The S&P 500 fell by more than 30% in just a few weeks, as fear led to massive sell-offs. However, this decline was followed by an equally rapid recovery, fueled by unprecedented monetary and fiscal stimulus.
Opportunity for the Bold: Investors who recognized the extreme fear in March 2020 as an overreaction had the opportunity to buy stocks at significantly depressed prices. Those who acted quickly saw substantial gains as the market rebounded, with the S&P 500 recovering all its losses and reaching new all-time highs by the end of the year.
In 2017, the cryptocurrency market experienced an explosive boom, with Bitcoin and other digital assets reaching unprecedented levels. Driven by greed, investors flocked to cryptocurrencies, hoping to capitalize on the rapid price increases.
Extreme Greed: Throughout 2017, the Fear and Greed Index for the cryptocurrency market showed extreme greed, particularly in the final months of the year. The index reflected the speculative frenzy as new and inexperienced investors entered the market, hoping to get rich quickly.
Market Reaction: Bitcoin’s price surged from around $1,000 at the beginning of 2017 to nearly $20,000 by December of that year. However, the rally was short-lived, as the market crashed in early 2018, with Bitcoin losing over 80% of its value within a year.
Ignoring the Signals: Despite clear indications of extreme greed, many investors ignored the risks and continued to buy at inflated prices. Those who failed to recognize the warning signs suffered significant losses when the bubble burst.
An investor must have astute awareness of the emotions driving their biases & behavior, particularly fear and greed. These emotions often lead to irrational decisions, pushing markets to extremes. The Fear and Greed Index helps investors gauge market sentiment, signaling when extreme fear may present buying opportunities or when extreme greed suggests caution.
While valuable, the Fear and Greed Index should be used alongside other analyses, such as technical and fundamental research. This comprehensive approach helps investors avoid emotional pitfalls and develop a disciplined investment strategy.
Even the smartest of investors are looking out for signs of hubris & behavioral biases. As you continue your investment journey, remember Warren Buffett’s advice: “Be fearful when others are greedy, and greedy when others are fearful.”
Discover investment portfolios that are designed for maximum returns at low risk.
Learn how we choose the right asset mix for your risk profile across all market conditions.
Get weekly market insights and facts right in your inbox
It depicts the actual and verifiable returns generated by the portfolios of SEBI registered entities. Live performance does not include any backtested data or claim and does not guarantee future returns.
By proceeding, you understand that investments are subjected to market risks and agree that returns shown on the platform were not used as an advertisement or promotion to influence your investment decisions.
"I was drawn to Wright Research due to its multi-factor approach. Their Balanced MFT is an excellent product."

By Prashant Sharma
CTO, Zydus
By signing up, you agree to our Terms and Privacy Policy
"I was drawn to Wright Research due to its multi-factor approach. Their Balanced MFT is an excellent product."

By Prashant Sharma
CTO, Zydus
Skip Password
By signing up, you agree to our Terms and Privacy Policy
"I was drawn to Wright Research due to its multi-factor approach. Their Balanced MFT is an excellent product."

By Prashant Sharma
CTO, Zydus
"I was drawn to Wright Research due to its multi-factor approach. Their Balanced MFT is an excellent product."

By Prashant Sharma
CTO, Zydus
Log in with Password →
By logging in, you agree to our Terms and Privacy Policy
"I was drawn to Wright Research due to its multi-factor approach. Their Balanced MFT is an excellent product."

By Prashant Sharma
CTO, Zydus
Log in with OTP →
By logging in, you agree to our Terms and Privacy Policy
"I was drawn to Wright Research due to its multi-factor approach. Their Balanced MFT is an excellent product."

By Prashant Sharma
CTO, Zydus
Answer these questions to get a personalized portfolio or skip to see trending portfolios.
Answer these questions to get a personalized portfolio or skip to see trending portfolios.
(You can choose multiple options)
Answer these questions to get a personalized portfolio or skip to see trending portfolios.
Answer these questions to get a personalized portfolio or skip to see trending portfolios.
Answer these questions to get a personalized portfolio or skip to see trending portfolios.
(You can choose multiple options)
Investor Profile Score
We've tailored Portfolio Management services for your profile.
View Recommended Portfolios Restart