by Siddharth Singh Bhaisora
Published On Dec. 22, 2024
Your 2024 Indian stock market recap is here. We look at key themes and turning points for the market that came up during each month in 2024. From interest rate cuts and budget-driven rallies to sector rotations and geopolitical shifts, we look at the eventful, yet volatile year that we have seen in 2024.
In January 2024, we highlighted 2 critical themes for investors: the implications of anticipated interest rate cuts on stock markets throughout the year and the strategic role of diversification across market capitalizations in optimizing returns.
Central banks globally are poised for significant interest rate reductions, driven by stabilizing inflationary pressures, easing supply chain disruptions, and moderated wage growth. These rate cuts, the steepest since 2009, are expected to spur economic activity and enhance stock market performance. For the Indian market, such monetary easing could provide a favorable environment for equity valuations and growth-oriented sectors.
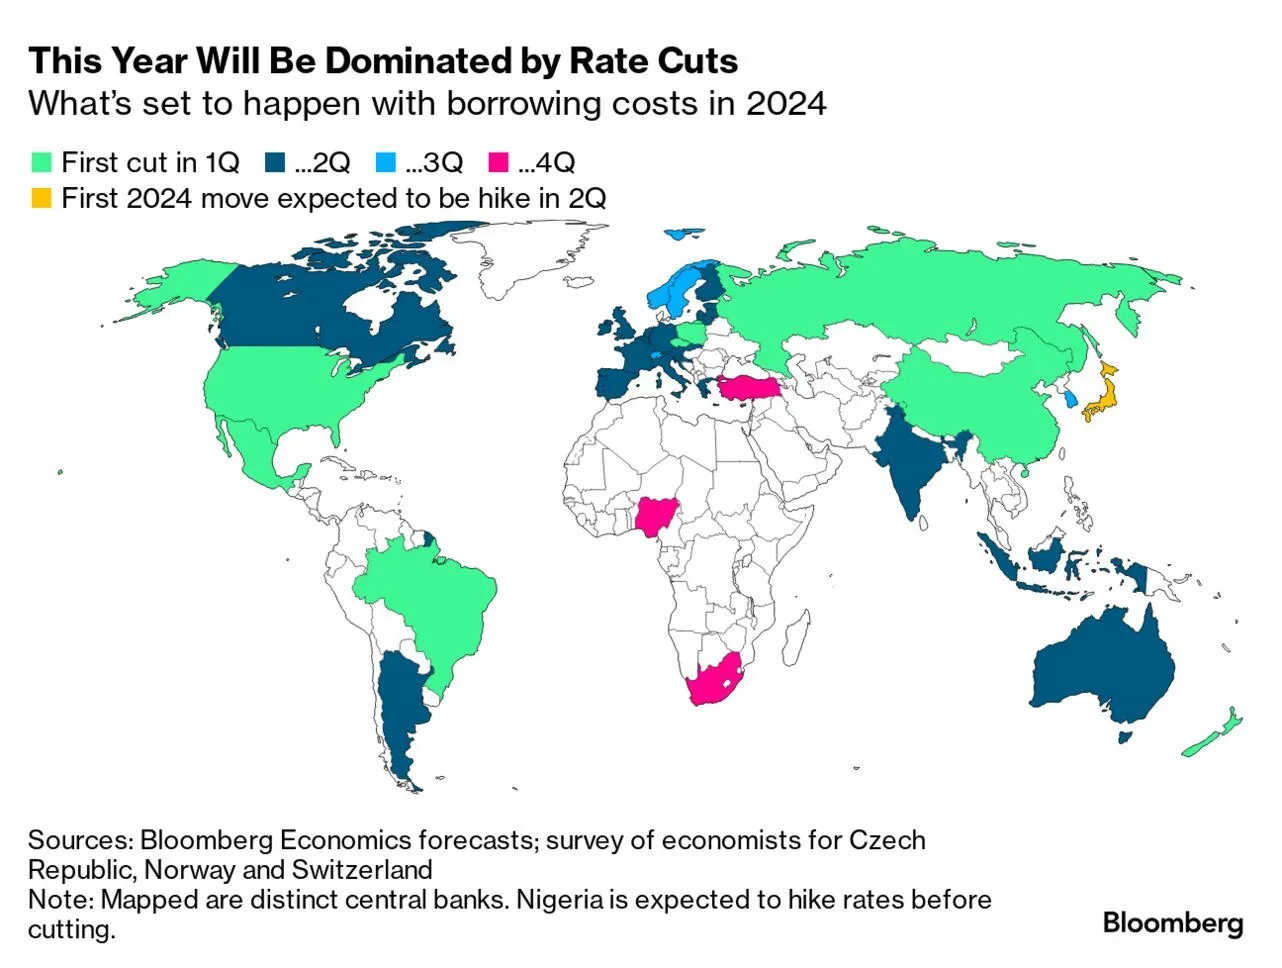
Now, these rate cuts could potentially lead to a highly volatile environment. In such a scenario, the portfolios need to be well diversified. By balancing exposure across large-cap, mid-cap, and small-cap stocks, investors can optimize their diversification ratio , a key metric for measuring portfolio efficiency. In years when the Nifty returns were positive, small-cap stocks showed the highest returns at approximately 33.98%, followed by mid-caps at around 30.98%, with large-caps trailing at about 24.20%.
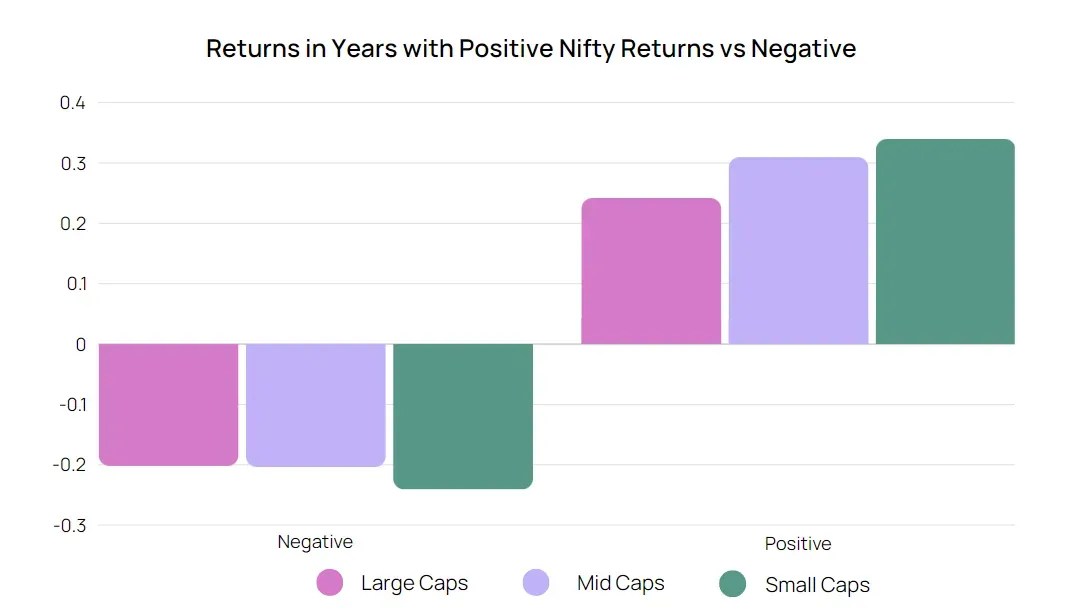
Diversification strategies should align with prevailing market conditions. Small-cap stocks, which perform well in bullish markets, should have a larger portfolio allocation during growth periods. Conversely, bearish markets call for increased allocation to large-caps to reduce risk. Investors are advised to adjust diversification ratios dynamically, decreasing small-cap exposure near market peaks and gradually increasing large-cap holdings as bearish signals arise. While small-caps can deliver higher returns in upswings, their volatility during downturns underscores the importance of a balanced approach with large-caps for effective risk management.
As we entered February, there was a strong PSU rally built on strong expectations from the interim budget & the upcoming elections. This rally was attributed to factors such as government reforms, strategic investments, and favorable policy changes aimed at enhancing the efficiency and profitability of public sector enterprises. Investors showed increased interest in PSUs, anticipating further reforms and potential divestment plans that could unlock value.
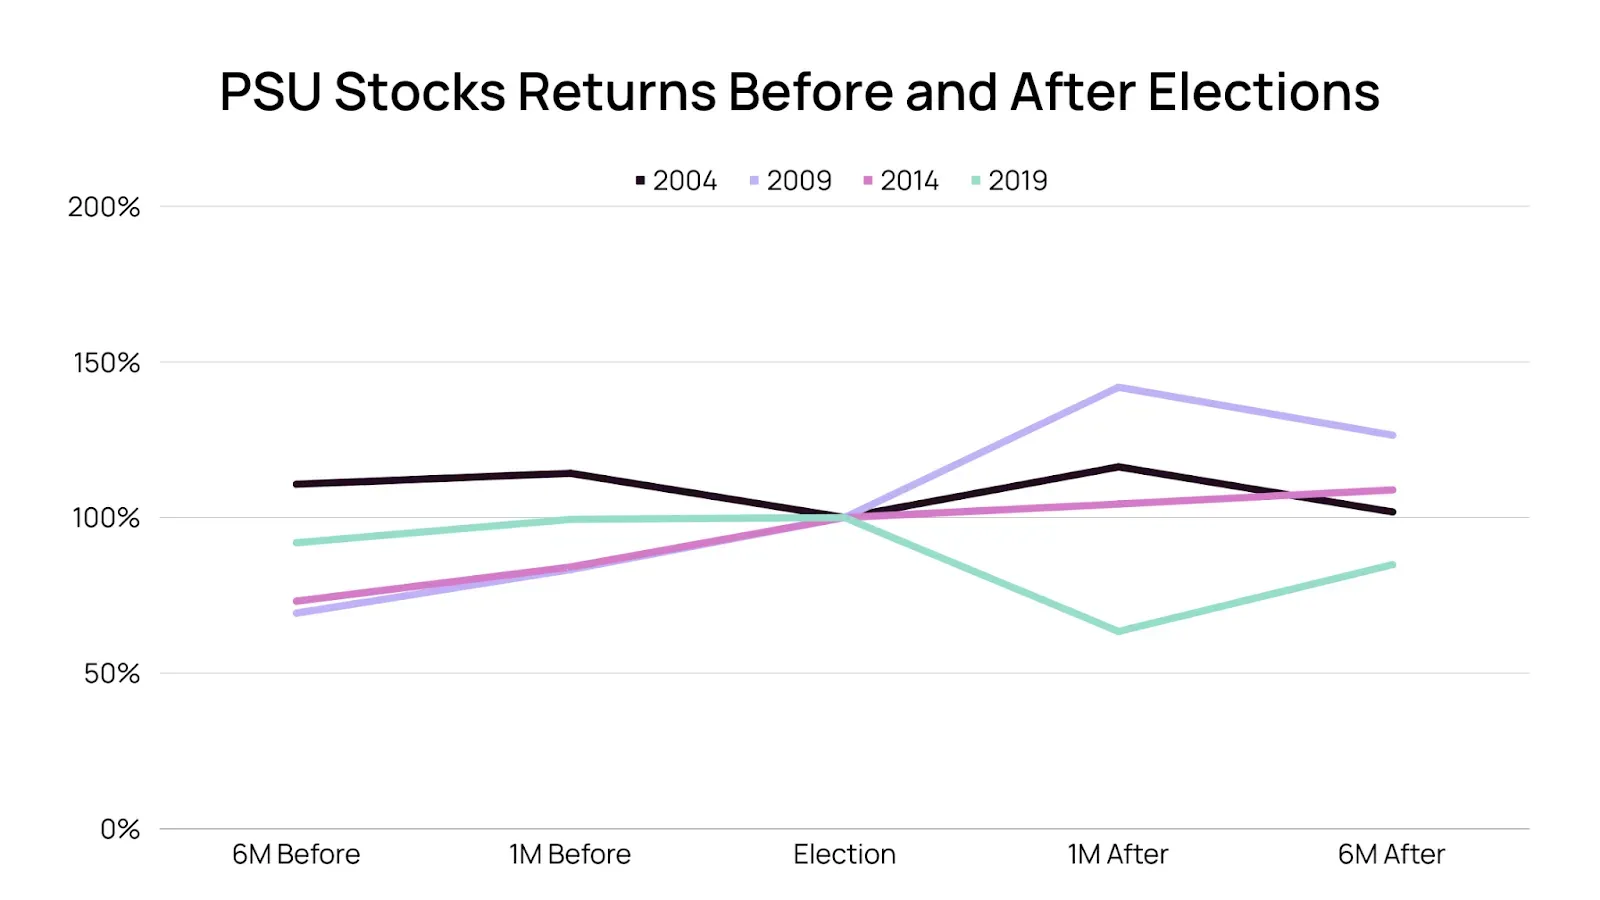
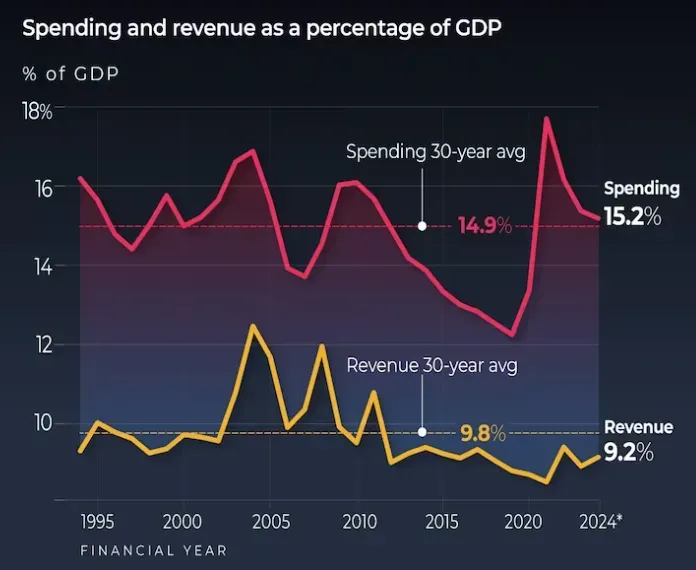
The Interim Budget for 2024 emphasized fiscal consolidation, aiming to reduce the fiscal deficit while boosting economic growth. Key allocations included substantial investments in infrastructure development, particularly under the PM GatiShakti initiative, focusing on enhancing the country's logistics and transportation networks. Additionally, sectors such as defense and railways received significant boosts, reflecting the government's commitment to strengthening these areas. The budget also addressed challenges in consumption, with measures aimed at stimulating demand and supporting various industries.
Determining the ideal rebalancing frequency is crucial for maintaining the performance of momentum-based investment strategies. Our research showed:
Annualized Returns: Across all rebalancing frequencies, our momentum strategy consistently delivered attractive annualized returns. However, the magnitude of returns varied depending on the rebalancing frequency employed.
Volatility: Rebalancing frequency had a noticeable impact on portfolio volatility. Generally, more frequent rebalancing resulted in lower volatility, while less frequent rebalancing led to higher volatility.
Max Drawdown: The maximum drawdown, representing the peak-to-trough decline in portfolio value, exhibited sensitivity to rebalancing frequency. Strategies with more frequent rebalancing tended to experience lower maximum drawdowns, indicating better downside protection.
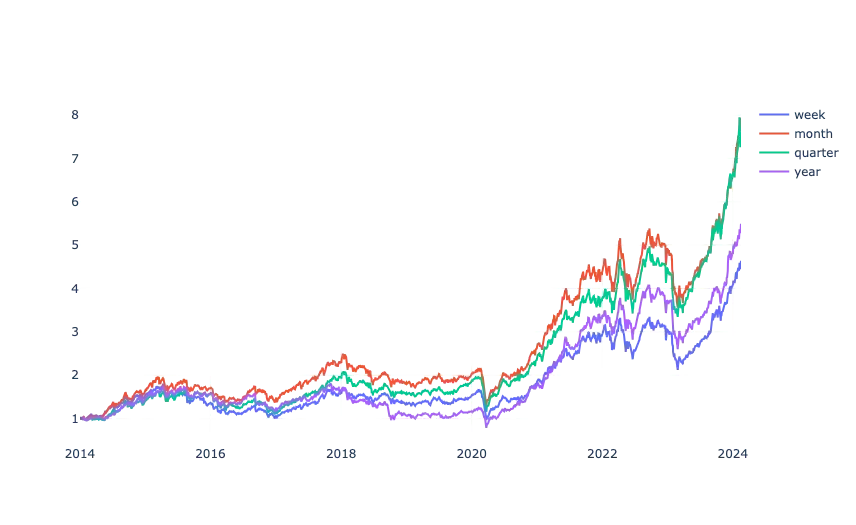
We found that a monthly rebalancing schedule is effective for momentum portfolios, allowing investors to capitalize on market movements while managing costs.
Historically, March has been a volatile month for Indian stocks, a phenomenon often referred to as the ' March Effect .' This volatility can be attributed to factors such as fiscal year-end adjustments, tax-related considerations, and portfolio rebalancing by institutional investors.
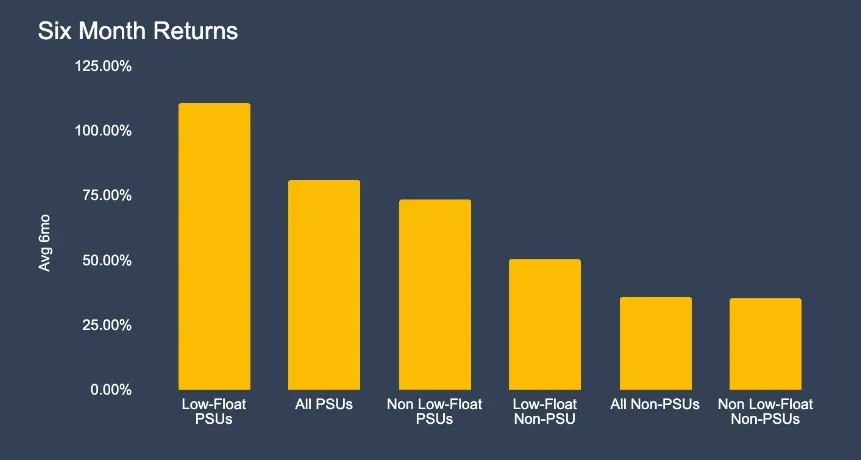
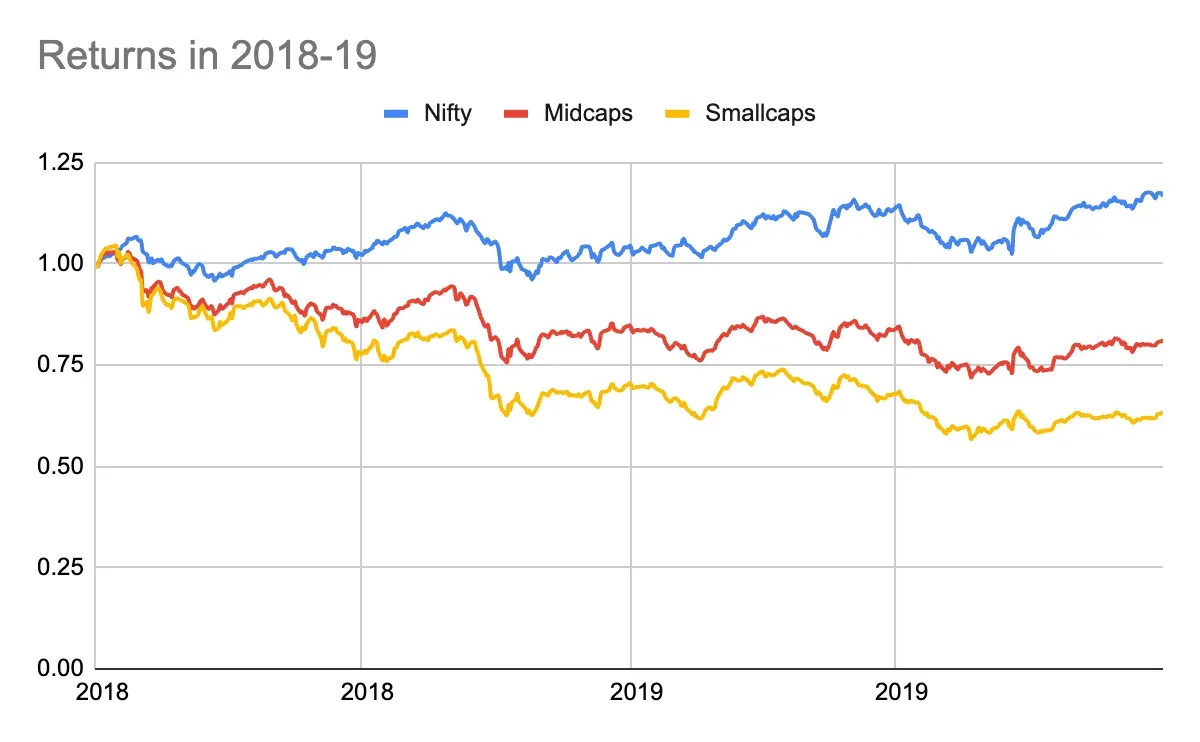
Looking at FY24 as a whole, equity inflows largely targeted low free-float segments, which outperformed the broader market, echoing the mid-cap rally of 2017 that saw declines in 2018. Low float stocks are those with a limited number of shares available for trading. Such stocks are more susceptible to price volatility due to their limited supply, which can amplify price movements when demand fluctuates. We saw an inverse relationship between stock returns and float levels, with non-large-cap valuations peaking at levels last seen during market highs. Low-float PSUs have significantly outperformed other stock groups, delivering a 110.7% six-month return and a remarkable 254.2% two-year return, far surpassing their non-low-float counterparts. Despite their strong returns, PSU earnings growth has not kept pace, indicating a reliance on valuation expansion rather than fundamentals. While low-float non-PSUs show high relative value within their sectors, low-float PSUs lag, suggesting investor over-optimism and potential speculative behavior in these segments.
SEBI & AMFI issued advisories to mutual funds , urging them to reassess large, one-time investments in small-cap and mid-cap funds. This move aimed to mitigate risks associated with the rapid inflow of investments into these funds, which had seen significant increases in assets under management (AUM) and raised concerns over valuation levels. SEBI's directive reflects concerns over the rapid increase in investments and the potential consequences of mass withdrawals, prompting fund houses to implement policies that protect investors and ensure market stability.
In light of market volatility and regulatory advisories, large-cap investments become stable options for capital preservation. Large-cap companies, due to their established market presence and robust financials, offer investors a safer avenue during uncertain times when we look at 2018-19 or even during the financial crisis.
Our Wright Titan portfolio was launched to provide investors with a core investment portfolio that targeted high quality, stable, large cap companies aiming to provide consistent returns while minimizing risks associated with smaller, more volatile stocks.
As we started the new financial year, the immediate theme was the upcoming Lok Sabha elections . Election years in India have traditionally been times of heightened market activity and investor interest, reflecting the anticipation and uncertainty surrounding potential policy changes and government stability. A review of historical market data shows a clear pattern: markets tend to perform well both in the run-up to the election and in the aftermath, driven by the expectations of continuity in economic policies and a stable political environment.
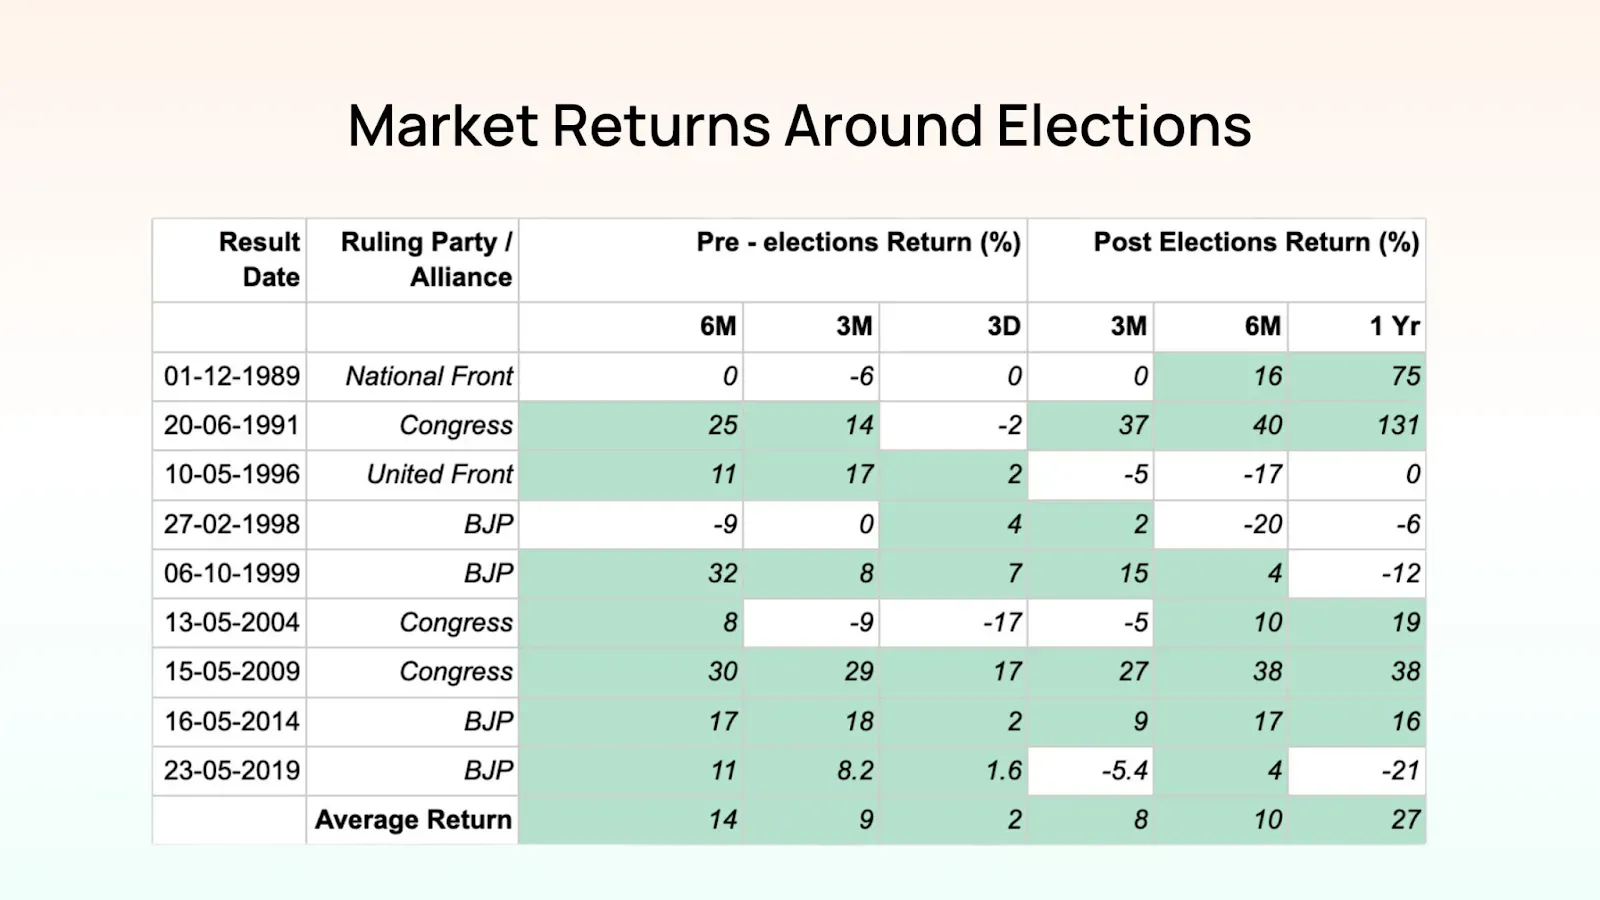
Analyzing data from past election cycles, it is evident that the six months leading up to the elections usually see a rise in market indices as investors begin to position their portfolios favorably based on predicted election outcomes. For instance, previous elections have shown an average market return increase, demonstrating positive investor sentiment spurred by prospective governance stability and anticipated reformative measures. The natural question many investors had was it the right time to top up their investment?
Our analysis of the Nifty 50 since 2014 shows a stark reality: missing even a handful of the best performing days can significantly impact your returns. Consider this: a simple buy-and-hold strategy yielded a CAGR of 13.08%. However, if you missed the top 20 best days, your CAGR drops to a mere 4.78%. That's a difference of over 8% annually! This highlights the power of compounding and the significant contribution of those high-growth days.
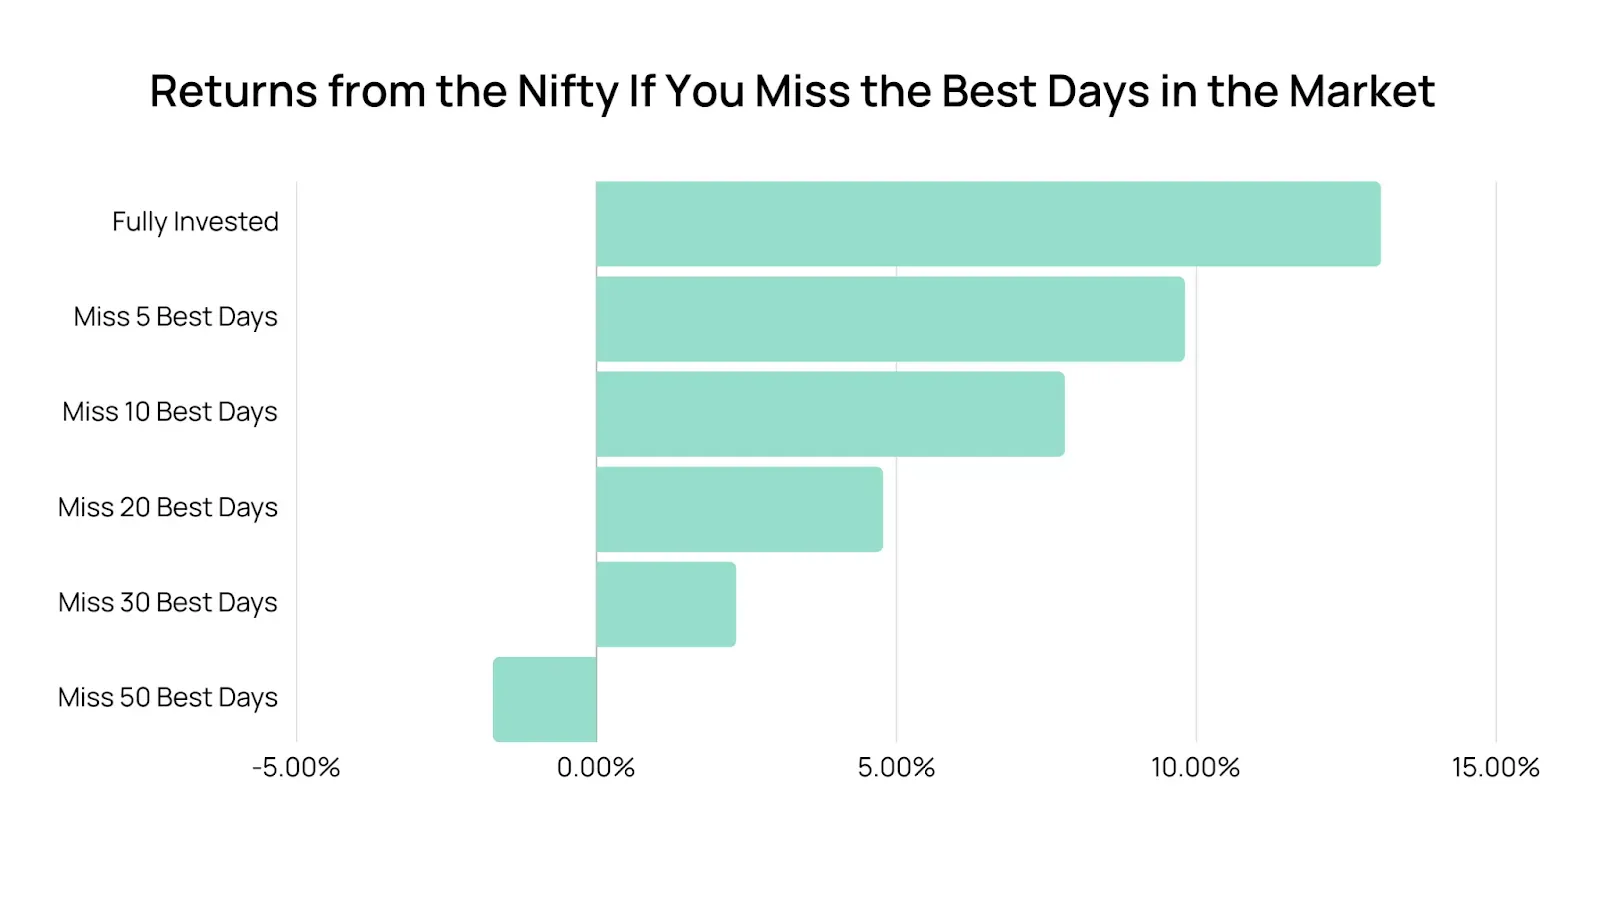
As we look at how the markets performed post the election period & even investing in the month of April, it appears that our hypothesis has held up over the 3M & 6M horizons from April.
As we entered May, Q4 FY24 earnings season showcased a divergence in sectoral performances. Domestic cyclical sectors, particularly BFSI & Automobiles, exhibited robust y-o-y net profit growth of 44%, amounting to ₹76,300 crore. In contrast, defensive sectors like Information Technology and Consumer Staples reported more subdued results. Notably, the Oil & Gas sector faced a downturn, with a 20% decline in earnings. Will cyclicals continue to outperform defensives in FY25 also?

The analysis of monopoly and near-monopoly companies in India revealed that out of 20 such firms, 13 outperformed the NIFTY 50 over a 15-year period. Notably, APL Apollo Tubes and Balkrishna Industries achieved cumulative returns of 135.71% and 95.74%, respectively. However, some monopolies like IEX, despite holding over 95% market share, registered a modest cumulative return of approximately 2.13% since its IPO in October 2017. This indicates that while market dominance can contribute to superior returns, it does not guarantee them, and investors should consider other factors such as company fundamentals and market conditions.
What was interesting while analysing monopolies is that the longer a company has been in existence, the higher the probability of its continued survival and success - also known as the Lindy Effect . Looking at Warren Buffett's portfolio the average age of the top 10 holdings is 108 years. Companies like Coca-Cola and American Express, with over a century of operational history, demonstrate sustained growth and stability, making them attractive long-term investments. However, investors should be cautious of survivorship bias and assess each company's current fundamentals and market position.
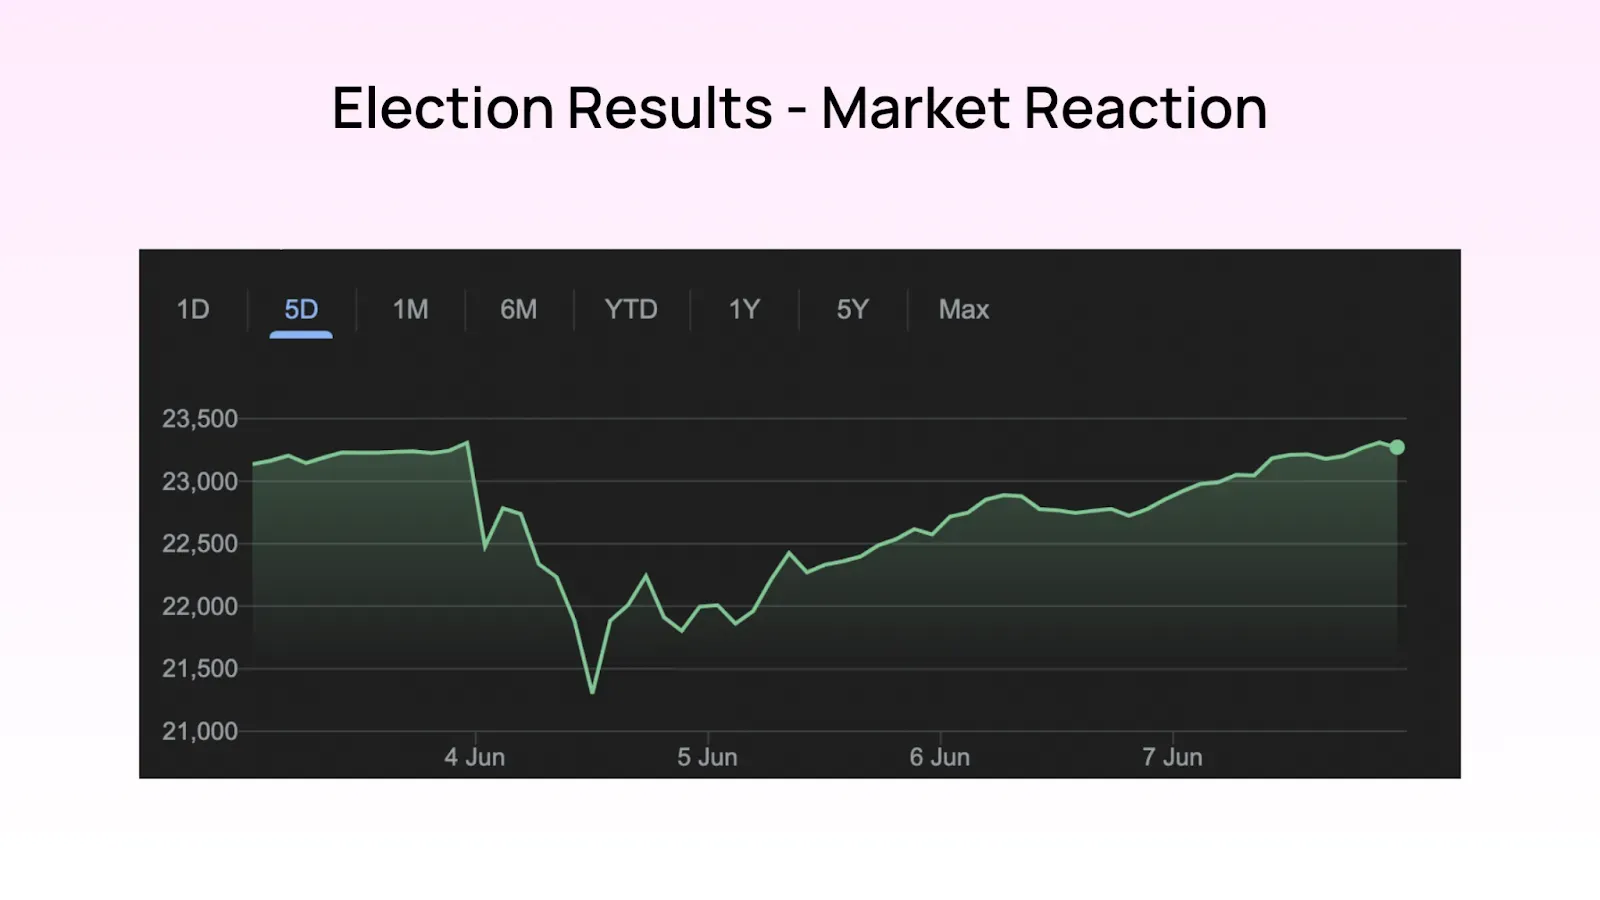
The 2024 Indian general elections reflect a more fragmented mandate, with the BJP needing to rely on coalition partners to form the government. Post-election, sectors such as infrastructure, manufacturing, and financial services were expected to do well.
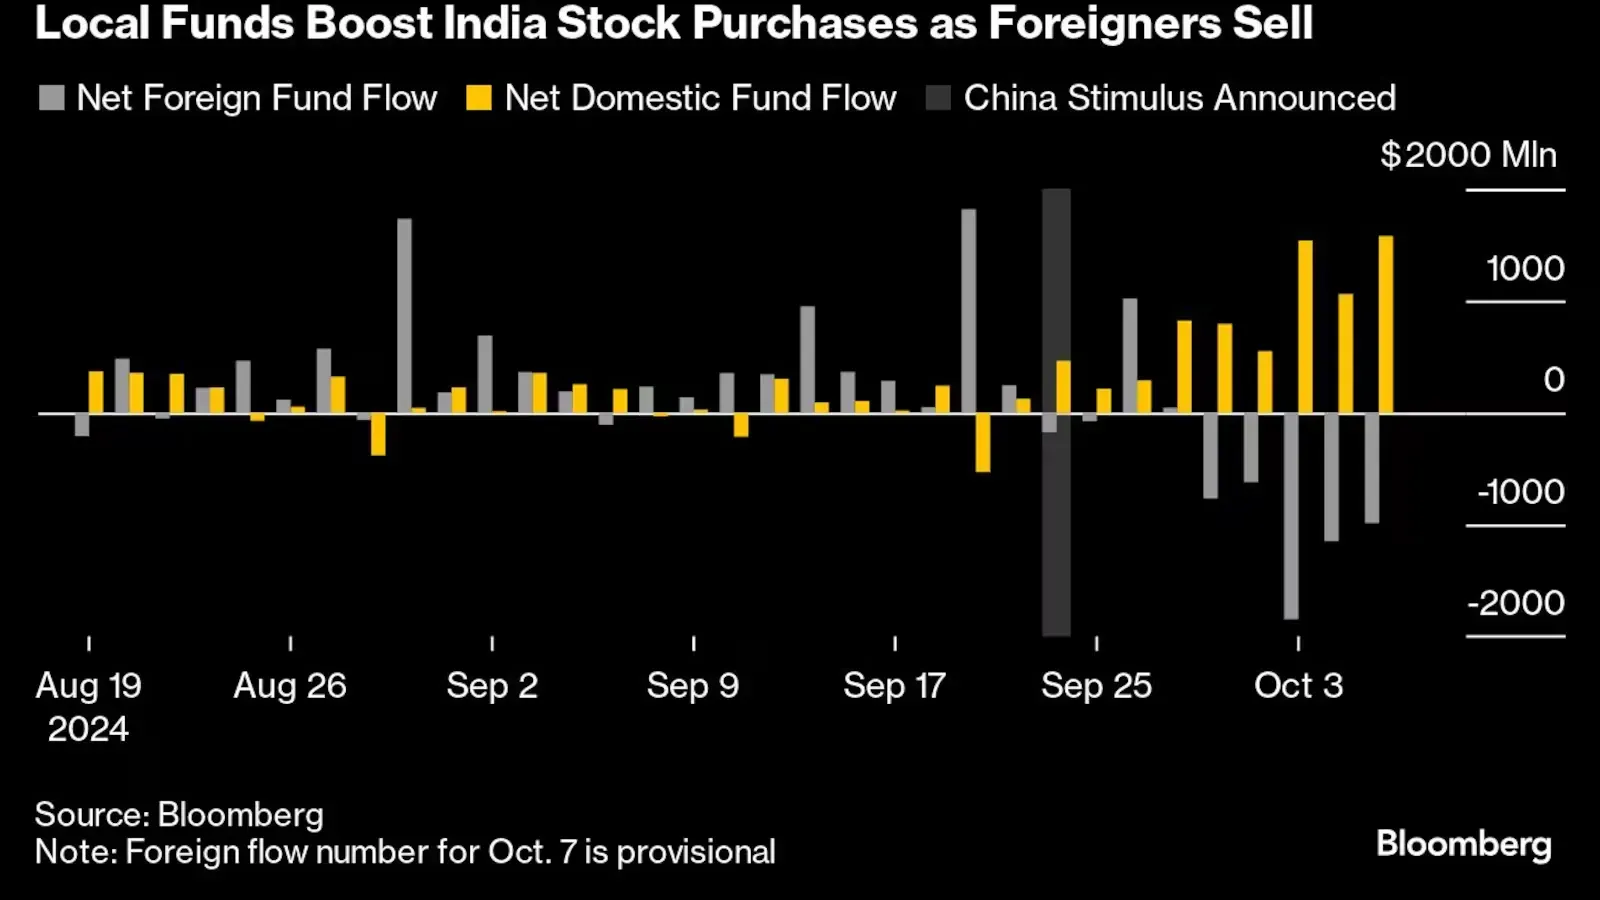
China's recent monetary and fiscal stimulus measures , including debt swaps, reduced borrowing rates, and policies to boost corporate buybacks and property purchases, have had a significant impact. While China's CSI 300 index surged over 30% shortly after the stimulus was announced, other Asian equity markets experienced significant outflows, including $15 billion from markets outside China, predominantly India and Korea. This movement has led to a healthier mean reversion in valuations across the region, aligning more closely with growth forecasts. India's market, previously trading at a significant premium, saw a substantial decrease in its PE ratio, making it more attractive to foreign investors.
With the new government elected, there is a new budget. The budget's focus on infrastructure development, green energy, and digitalization presents growth opportunities in sectors such as construction, renewable energy, and technology. The Union Budget 2024-25 introduced significant changes to capital gains taxation , affecting various investment vehicles:
Short-Term Capital Gains (STCG): The tax rate on short-term capital gains for equity-oriented funds was increased from 15% to 20%, effective July 23, 2024. Wright Research
Long-Term Capital Gains (LTCG): The tax rate on long-term capital gains for equity investments was raised from 10% to 12.5%.
The natural question was - will direct equity investments & PMS investments need to substantially outperform mutual funds or AIFs to beat the increase in capital gains? Our detailed analysis of capital gains tax hike on smallcases & PMS vs. mutual funds & AIFs showed the net returns needed from direct equity investments or PMS portfolios is around 2.5% to match mutual fund returns post tax.
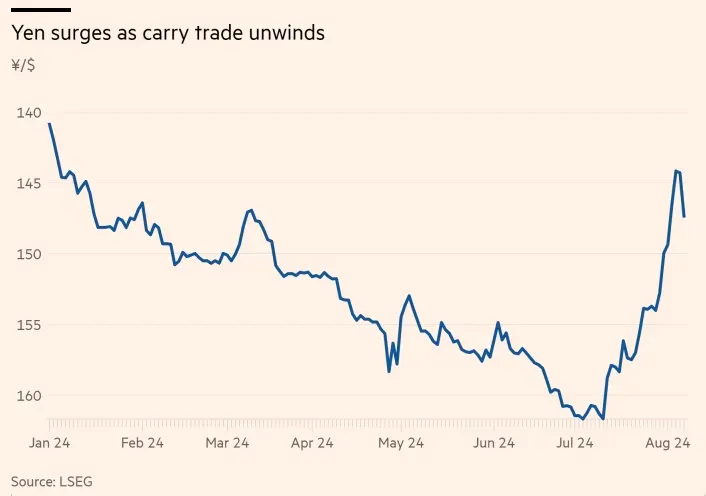
The unwinding of the Japanese Yen carry trade was primarily driven by the Bank of Japan raising interest rates from near-zero levels to 0.25%, marking a significant departure from its long-standing ultra-loose monetary policy. By tightening its monetary policy, raising interest rates for the first time in years and signaling the possibility of more hikes to come, the Bank of Japan is looking at controlling rising inflation and stabilizing the economy. This has led to a sharp appreciation of the yen, which has surged by 13% in just a month. The stronger yen has made it increasingly costly for investors to maintain their yen-funded positions, forcing them to unwind these trades rapidly.
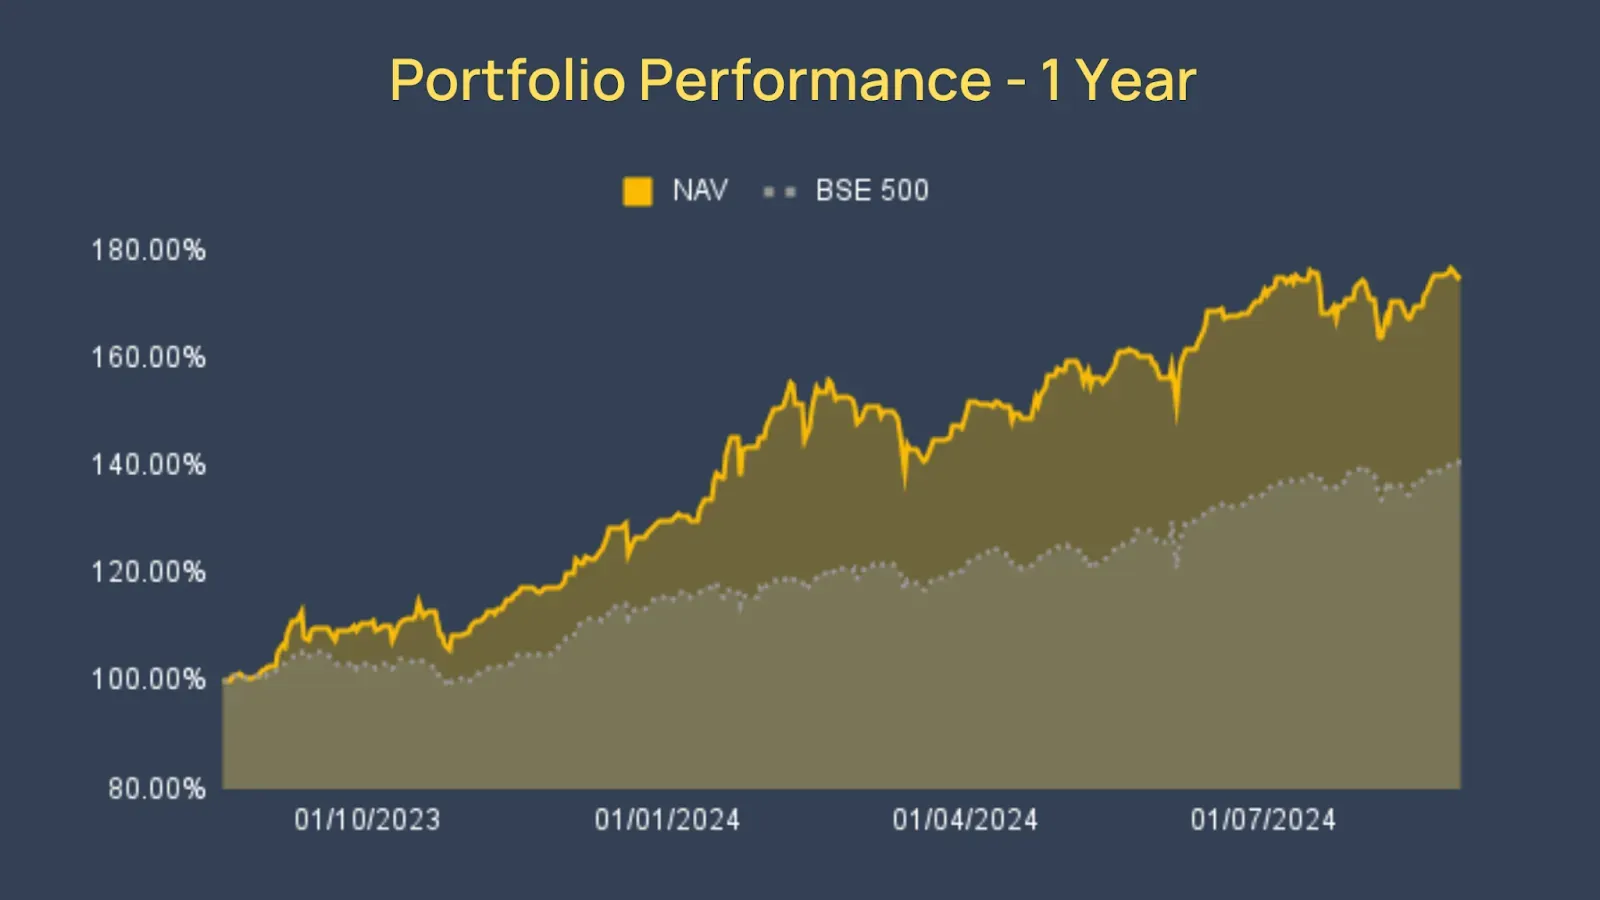
At the end of August our PMS completed 1 full year of operations. Our Factor Fund, the flagship strategy, has delivered an impressive 80% return in the 1 year of Wright PMS . This performance is particularly noteworthy given the market’s volatility, with our fund consistently outperforming the BSE 500 by a significant margin.
Reached ₹250 crore AUM within the first year.
Demonstrated resilience during market volatility, with a limited 3.7% dip during sharp corrections, compared to the broader market's 6.5% decline.
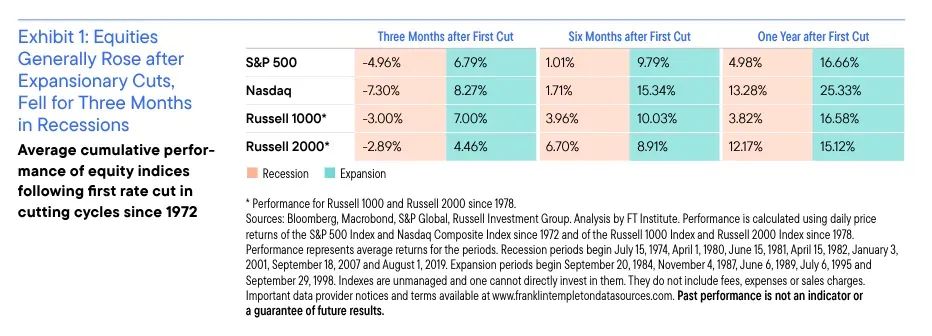
Interest rate cuts during recessions or expansions by central banks have varying effects on stock markets. During expansions rate cuts can stimulate economic activity, often leading to positive stock market performance. Historical data indicates that equities tend to outperform bonds and cash in such scenarios, as reduced borrowing costs encourage investment and consumption. Rate cuts in recessionary periods may signal economic distress, potentially resulting in subdued or negative stock market returns. Investors may exhibit caution, and the anticipated economic stimulus may not immediately translate into market gains.
A fast cycle involves 5 or more rate cuts in a year, while a slow cycle sees fewer than 5 cuts. "Non-cycles" consist of just one rate cut. The impact on the stock market, as seen through the S&P 500, varies significantly depending on the speed of these interest rate cuts.
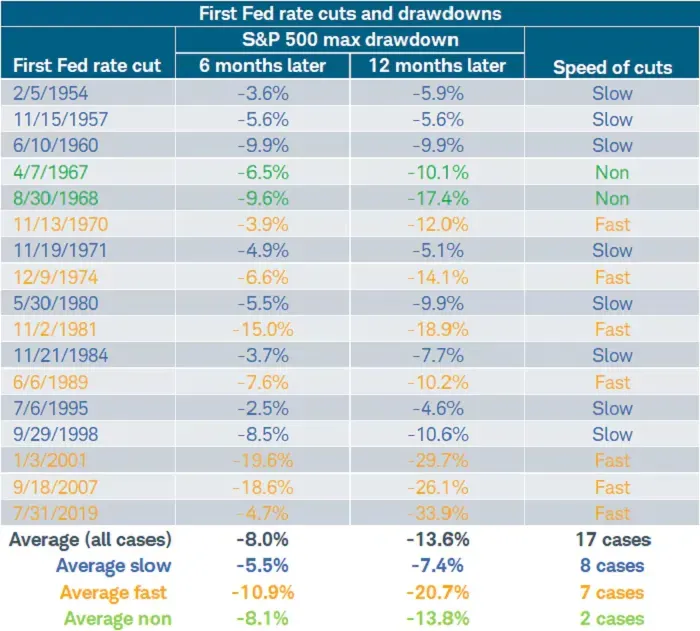
Post-WWII data shows that slow cutting cycles have been more beneficial for equities, particularly in the first year after the initial cut, compared to fast cycles. Fast cuts generally indicate the Fed is reacting to a recession or financial crisis, leading to higher volatility and greater stock market drawdowns.
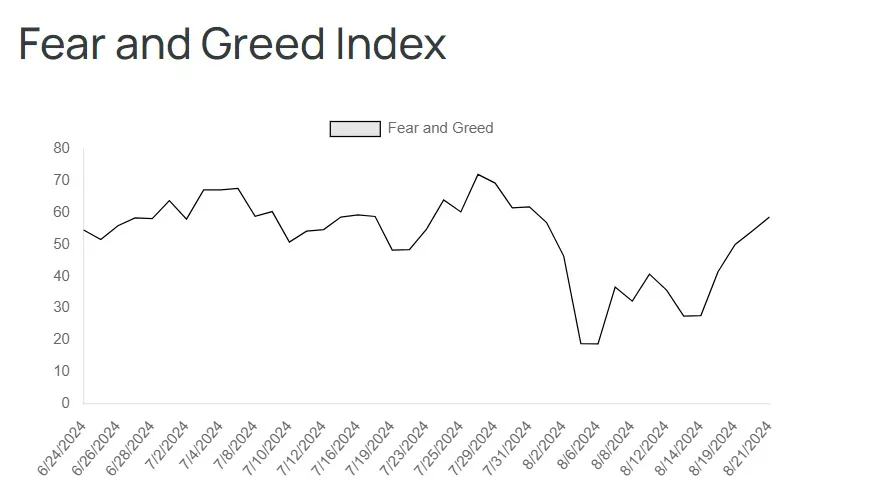
Investor behavior in the stock market is significantly influenced by the emotions of greed and fear, often leading to market volatility and deviations from fundamental values. The Fear and Greed Index serves as a valuable tool to gauge market sentiment, assisting investors in making informed decisions. By understanding and managing these emotional drivers, investors can adopt a more disciplined approach, potentially capitalizing on market overreactions and identifying opportunities during periods of excessive pessimism or optimism.
Geopolitical tensions between Israel and Iran, coupled with China's recent stimulus measures and U.S. macroeconomic data introduced volatility into Indian stock markets. Foreign investors pulled more than $5 billion from Indian equities this month, driving the benchmark index down over 3%. The exodus reflected growing concerns about India's high stock valuations. There was evidence that recent gains in China’s markets have come at the expense of Indian equities. Some foreign investors were reallocating funds from India to China to capitalize on lower valuations.
Energy Sector: Escalating Middle East tensions have led to surges in crude oil prices, impacting Indian energy companies and increasing import costs.
Pharmaceutical and IT Sectors: Global uncertainties have prompted investors to seek refuge in defensive sectors, leading to increased interest in Indian pharmaceutical and IT stocks.
In September in India, stocks previously expected to benefit from Prime Minister Narendra Modi's re-election had underperformed, as investors increasingly favor defensive sectors like consumer and technology. While an index of so-called "Modi stocks" had only climbed 2% since Modi began his third term in June, consumer and software stocks have surged by 20% and 34%, respectively.
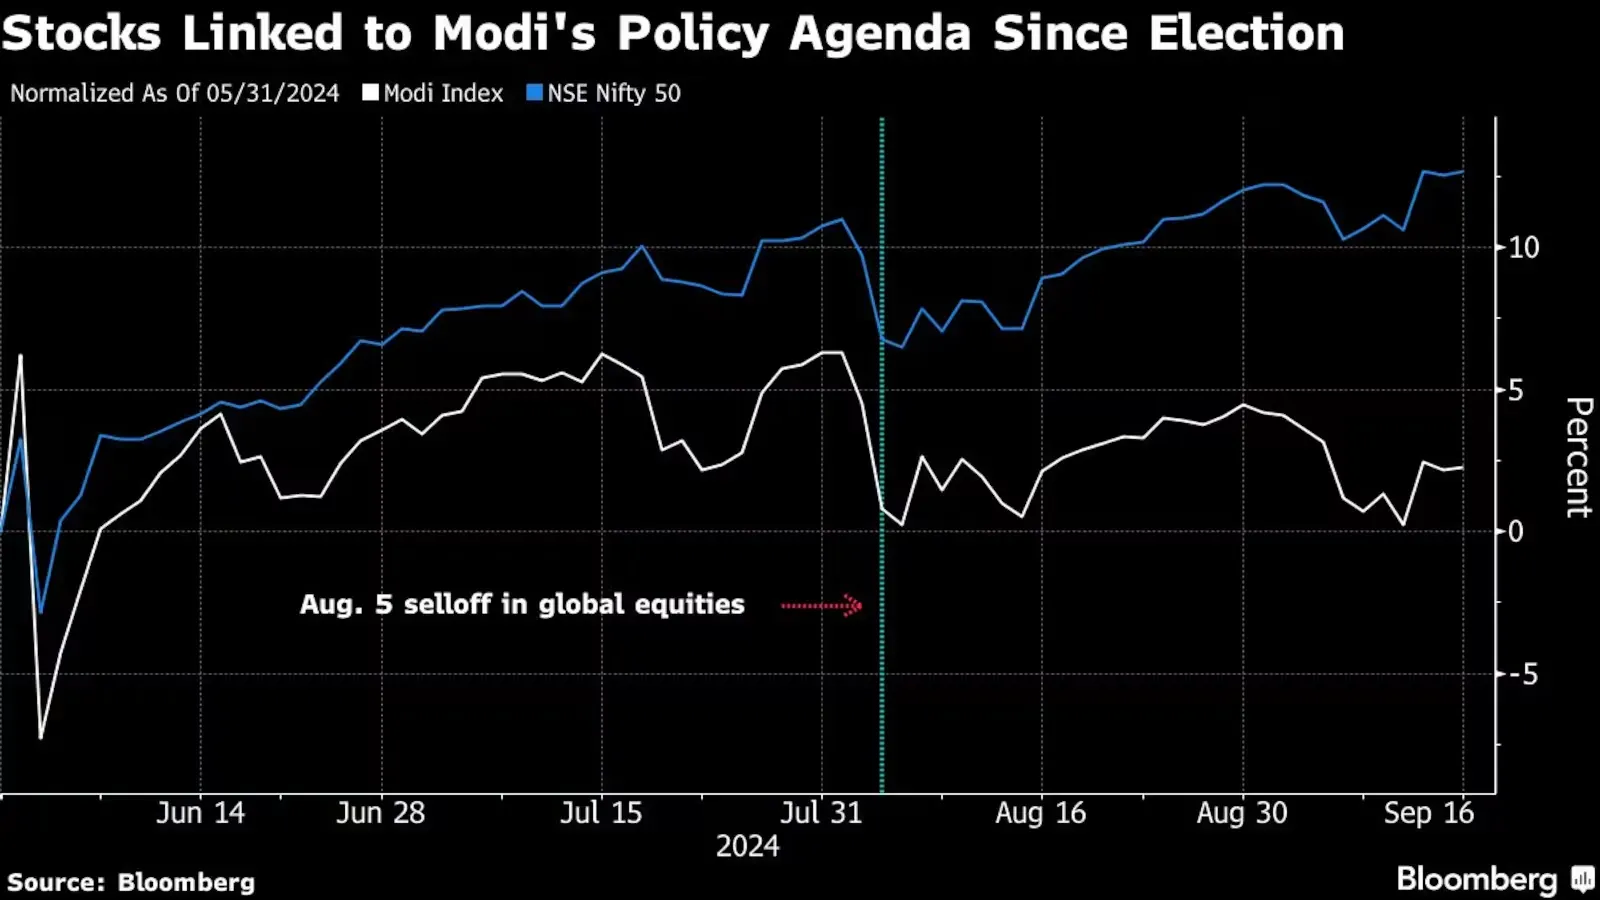
This rotation into defensive stocks was seen as a risk-off response to growing global economic uncertainties. Factors such as warning signs of a slowdown in the U.S., stagnation in China’s economic policies, and the continued weak performance of the Eurozone pushed investors toward more stable, fundamentally-driven sectors.
The Trump presidency presents a mixed outlook for India , with opportunities in IT, pharma, EMS, and defense sectors, balanced by risks from tariffs and geopolitical complexities. High valuations and moderating domestic earnings growth suggest that Indian equities may see limited upside, though domestic liquidity and demand for U.S.-linked sectors provide support. While India stands to benefit as a strategic U.S. ally in an anti-China context, its evolving ties with China introduce a nuanced dynamic in the U.S.-India-China triangle. The Trump administration’s aggressive trade stance could disrupt supply chains and intensify competition in global markets, with indirect impacts on India’s exports and industry.
Following the US election results, the Indian stock market experienced notable correction , influenced by several global and domestic factors:
Stretched Valuations: Prior to the correction, certain sectors, including Oil & Gas and Energy, had declined by over 21% from their 52-week highs, indicated potential overvaluation.
Global Economic Uncertainties: Geopolitical tensions, re-election of Donald Trump, global protectionist policies, raised questions around global trade stability.
Commodity Price Volatility: Fluctuations in commodity prices, especially in energy, have put additional pressure on sectors like Oil & Gas, further exacerbated the correction.
Domestic Economic Indicators: The equity Assets Under Management (AUM) of domestic mutual funds fell by 3.6% month-over-month due to declines in the Nifty index, reflected investor caution.
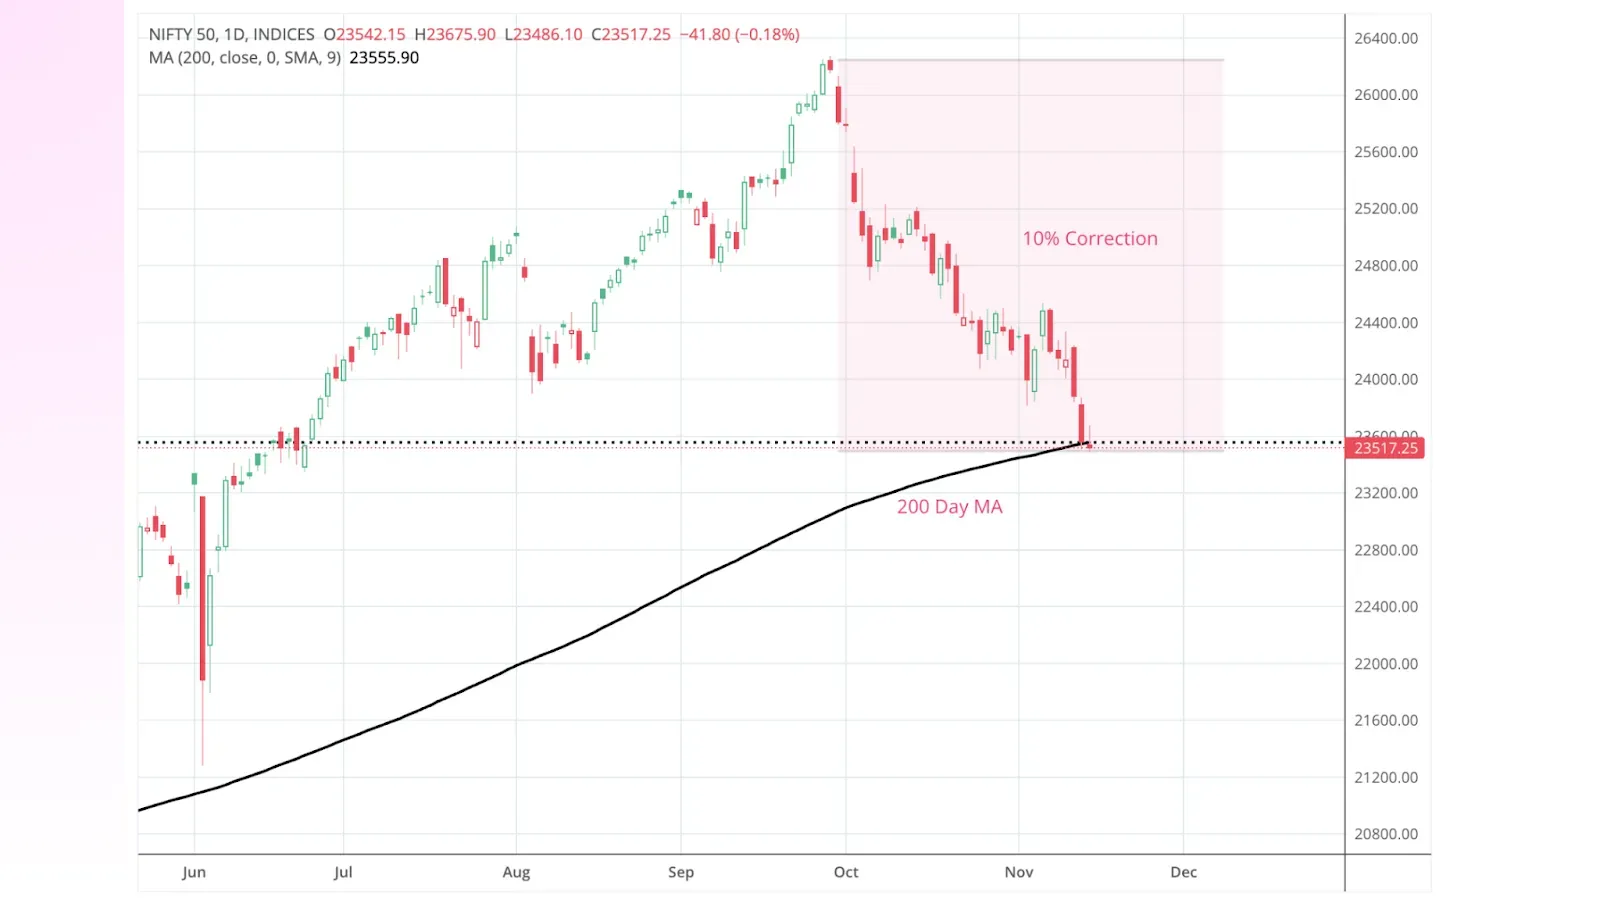
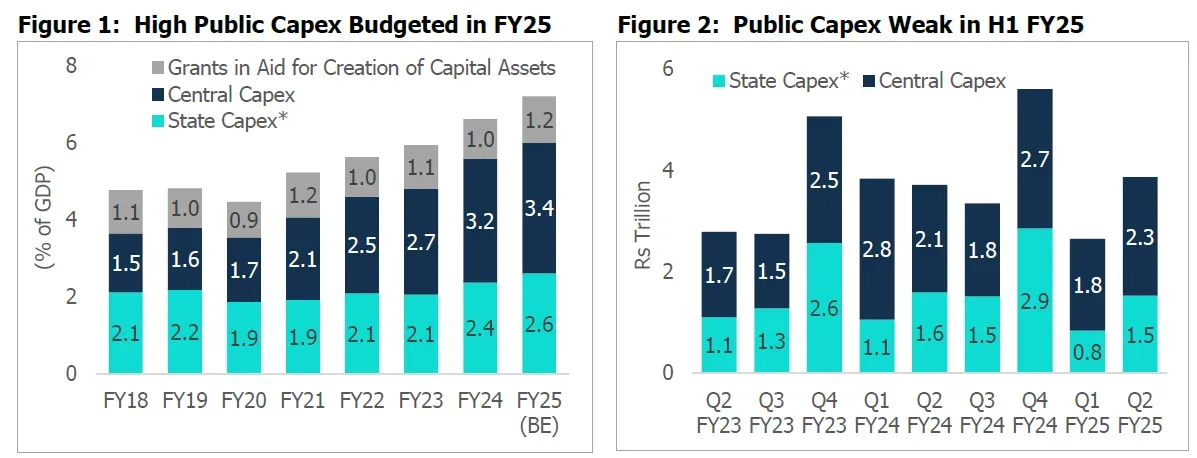
In the first half of FY25, India's capex experienced a slowdown , with completion rates hitting a 5 year low of 42% as of October 2024. This deceleration was attributed to factors such as general election-related restrictions and geopolitical uncertainties. Despite these challenges, there are strong indications of a capex revival in the second half of FY25:
Government Initiatives: The central government's capex allocation for FY25 has risen to 3.4% of GDP, more than doubling from 1.6% in FY19. This increase underscores a commitment to infrastructure development, with a projected 25% year-on-year increase in capex during the latter half of the fiscal year.
Private Sector Participation: While private sector capex has lagged, there are signs of recovery. Corporate bond issuances, which fell by 33.7% year-on-year in Q1 FY25 due to election uncertainties, rebounded with a 67.9% increase in Q2. Additionally, net Foreign Direct Investment (FDI) inflows, which had declined by 64% year-on-year in FY24, recovered by 103% year-on-year in the April-August period of FY25, supported by India's growing role as an alternative manufacturing hub.
2024 has been a rollercoaster for Indian markets. Despite challenges, 2024 laid the groundwork for renewed growth in 2025. The anticipated revival of capex in the latter half of FY25, alongside improving private sector participation and robust government initiatives, signals a promising future.
Central bank rate cuts globally set the tone for market performance, with Indian equities benefiting from favorable monetary policy despite pockets of volatility.
Investors balanced the allure of high-growth small-cap stocks with the stability of large-caps, adjusting allocations dynamically to optimize returns in a volatile environment.
Political uncertainty around the Lok Sabha elections influenced market sentiment, with historical patterns of pre-election optimism holding true.
Shifts from cyclical to defensive sectors underscored the importance of adapting to changing macroeconomic conditions.
Policy changes tested the agility of investors, emphasizing the need for strategies that maximize post-tax returns.
Foreign investor dynamics, driven by events such as the Chinese economic recovery and U.S. policy shifts, impacted Indian markets, reminding us of the interconnected nature of modern finance.
As we turn the page to 2025, investors would do well to carry forward the lessons of adaptability, disciplined strategy, and long-term perspective gleaned from the eventful year of 2024. With the Indian growth story holding strong, opportunities abound for those ready to navigate the complexities of the market.
As of now stock markets are ending flat in December, the question remains will the December effect result in higher returns?
Discover investment portfolios that are designed for maximum returns at low risk.
Learn how we choose the right asset mix for your risk profile across all market conditions.
Get weekly market insights and facts right in your inbox
It depicts the actual and verifiable returns generated by the portfolios of SEBI registered entities. Live performance does not include any backtested data or claim and does not guarantee future returns.
By proceeding, you understand that investments are subjected to market risks and agree that returns shown on the platform were not used as an advertisement or promotion to influence your investment decisions.
"I was drawn to Wright Research due to its multi-factor approach. Their Balanced MFT is an excellent product."

By Prashant Sharma
CTO, Zydus
By signing up, you agree to our Terms and Privacy Policy
"I was drawn to Wright Research due to its multi-factor approach. Their Balanced MFT is an excellent product."

By Prashant Sharma
CTO, Zydus
Skip Password
By signing up, you agree to our Terms and Privacy Policy
"I was drawn to Wright Research due to its multi-factor approach. Their Balanced MFT is an excellent product."

By Prashant Sharma
CTO, Zydus
"I was drawn to Wright Research due to its multi-factor approach. Their Balanced MFT is an excellent product."

By Prashant Sharma
CTO, Zydus
Log in with Password →
By logging in, you agree to our Terms and Privacy Policy
"I was drawn to Wright Research due to its multi-factor approach. Their Balanced MFT is an excellent product."

By Prashant Sharma
CTO, Zydus
Log in with OTP →
By logging in, you agree to our Terms and Privacy Policy
"I was drawn to Wright Research due to its multi-factor approach. Their Balanced MFT is an excellent product."

By Prashant Sharma
CTO, Zydus
Answer these questions to get a personalized portfolio or skip to see trending portfolios.
Answer these questions to get a personalized portfolio or skip to see trending portfolios.
(You can choose multiple options)
Answer these questions to get a personalized portfolio or skip to see trending portfolios.
Answer these questions to get a personalized portfolio or skip to see trending portfolios.
Answer these questions to get a personalized portfolio or skip to see trending portfolios.
(You can choose multiple options)
Investor Profile Score
We've tailored Portfolio Management services for your profile.
View Recommended Portfolios Restart