by Akashdeep Bhateja, Himanshu Agrawal
Published On Aug. 28, 2023
Pair trading stocks, also known as pairs trading, is a market-neutral strategy that involves matching a long position with a short position in two stocks that have historically moved together. Pairs trading is used by those investors interested in algo trading, particularly statistical arbitrage. The goal of pair trading is to capitalize on the relative performance between the two stocks, rather than their absolute performance. By employing pair trading, investors can potentially profit from the divergence and convergence of stock prices, regardless of overall market conditions. Understanding the nuances of pairs trading, such as selecting the right pair trading stocks and timing the trades accurately, is crucial for maximizing returns and minimizing risks.
In the increasingly complex world of algorithmic trading, the pairs trading strategy stands out for its relative simplicity and potential for consistent returns. This article will delve into the intricate details of pairs trading, explaining its core concepts, the mathematical backbone of the strategy, pairs trading stock list and how to implement it using modern technologies. Our focus is on enhancing your understanding of pairs trading and algorithmic trading, preparing you for successful implementation.
Pairs trading, at its core, is a strategy that involves taking offsetting long and short positions in a pair of highly correlated stocks. The underlying premise of pairs trading is that the spread between two correlated stocks will fluctify around a mean. If these stocks diverge from their typical behavior, the strategy anticipates a reversion to the mean, profiting from the convergence.
Consider, for instance, the Indian indices, Nifty & Bank Nifty. These assets have historically exhibited high correlation. By implementing a pairs trading strategy, we could potentially benefit from the instances when this correlation breaks. This brings us to the mathematical principles underlying pairs trading, which are essential for designing effective algo trading strategies.
The mathematics behind pairs trading involves advanced statistical concepts like mean reversion, correlation, co-integration, and stationary stochastic processes. A good understanding of these principles is fundamental to developing an effective pairs trading algorithm.
Correlation is the statistical measure of how two securities move concerning each other. We could measure the correlation between Nifty and Bank Nifty by comparing their price data. The closer to 1, the stronger the positive correlation is.
Co-integration goes a step further and looks at the relationship between two securities over the long term. Co-integration ensures that the movements between the two securities, despite their short-term deviations, remain connected in the long run.
To test co-integration, we can use the Engle-Granger method, which checks the residuals from a static regression for a unit-root presence, using the Augmented Dickey-Fuller Test (ADF) or other similar tests.
Next, the concept of Stationarity and Mean Reversion is crucial to our pairs trading strategy. A stationary time series has a constant mean and variance over time. If we establish that the residuals from the regression of our pair of securities form a stationary series, we can predict with confidence that the values will return to their mean.
The plots of the regression residuals provide a valuable visual aid. The ADF test also comes in handy for determining stationarity.
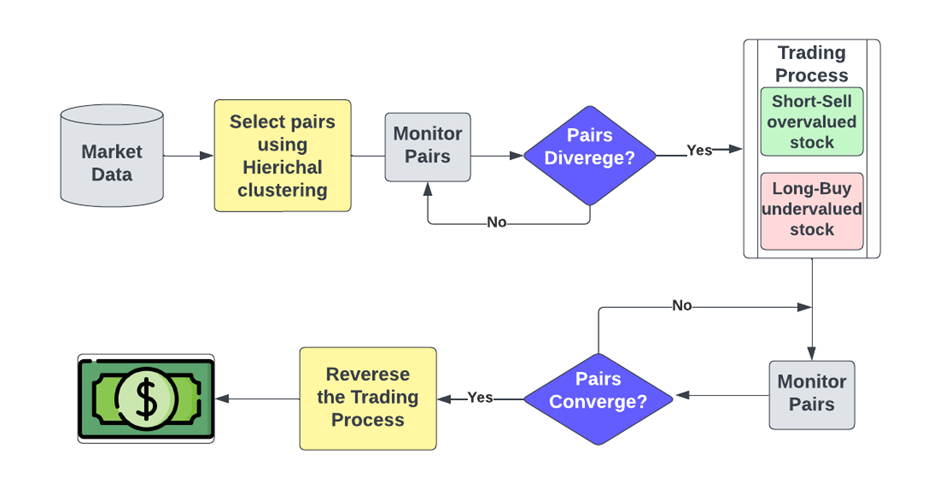
Now that we understand the pairs trading
strategy,let's look at how it couldwork. We start by choosing
pairs, which can be done with"hierarchical clustering." It
involves looking at the past prices of linked assetsusing similar
measureslike correlation. By making a dendrogram, things that have had
strong connections in the past are put together. The chosen pairs are used to
make trading decisions, which leads to gains. The following flowchart summaries
the process.
As we've seen, these easy pair trading strategies are very effective. And every strategy needs to be judged on its risk, not just on how much money it could make. Let's take a look at the pros and cons of using pairs trading techniques.
• This strategy has potential to generate returns regardless of market direction as it is a market-neutral strategy
• This can offer some protection from the broader market's ups and downs.
• Profits are derived from relative performance of two assets which aims to reduce the exposure to systematic risk
• The strategy is based on finding mispricing or deviations from historical correlations. These deviations are assumed to return to their historical mean, giving traders a statistical edge.
• This strategy is based on past correlations, which can be broken by market events like economic changes, etc. This could cause unexpected loses.
• It includes buying and selling stocks simultaneously, making it complext and prone to timing problems and slippage.
• Temporary changes from the historical average can cause losses if trader exits trades early
• Since it involves short selling, it may need margin and leverage, which can make gains and losses bigger, increasing the overall risk profile.
• Frequent rebalancing can result in higher transaction costs which can affect returns.
The pairs trading approach is to trade two related assets by going long on one and short on the other. The primary objective of the strategy is to make money when their prices come closer together. The basic equation for selling in pairs looks like this:
Profit=(P_1- β.P_2 )- α
Where:
P_1 is the price of the first asset in the pair.
P_2 is the price of the second asset in the pair.
β is the hedge ratio or the coefficient of the second asset's price in the linear combination.
α is the constant term in the linear combination.
The goal is to find a good pair of assets based on how well they have gone together in the past. Techniques like linear regression are used to figure out the best hedge ratio, β, for a linear mix of the prices of the assets. Any difference in price between the pair is taken into account by the constant term, α.
The goal of trading pairs is to make money when the linear mixture (spread) of the prices of the assets goes back to its historical mean. When the spread is very different from its average, the plan is to buy the asset with the lower spread value and sell the asset with the higher spread value. As the difference goes back to its average, money is made.
Remember that there are other things to consider when putting pairs trading into motion, like transaction costs, risk management, position sizing, and the constant monitoring of the spread and the relationship between the pairs.
We start off by correlation between the price data of the two indices.
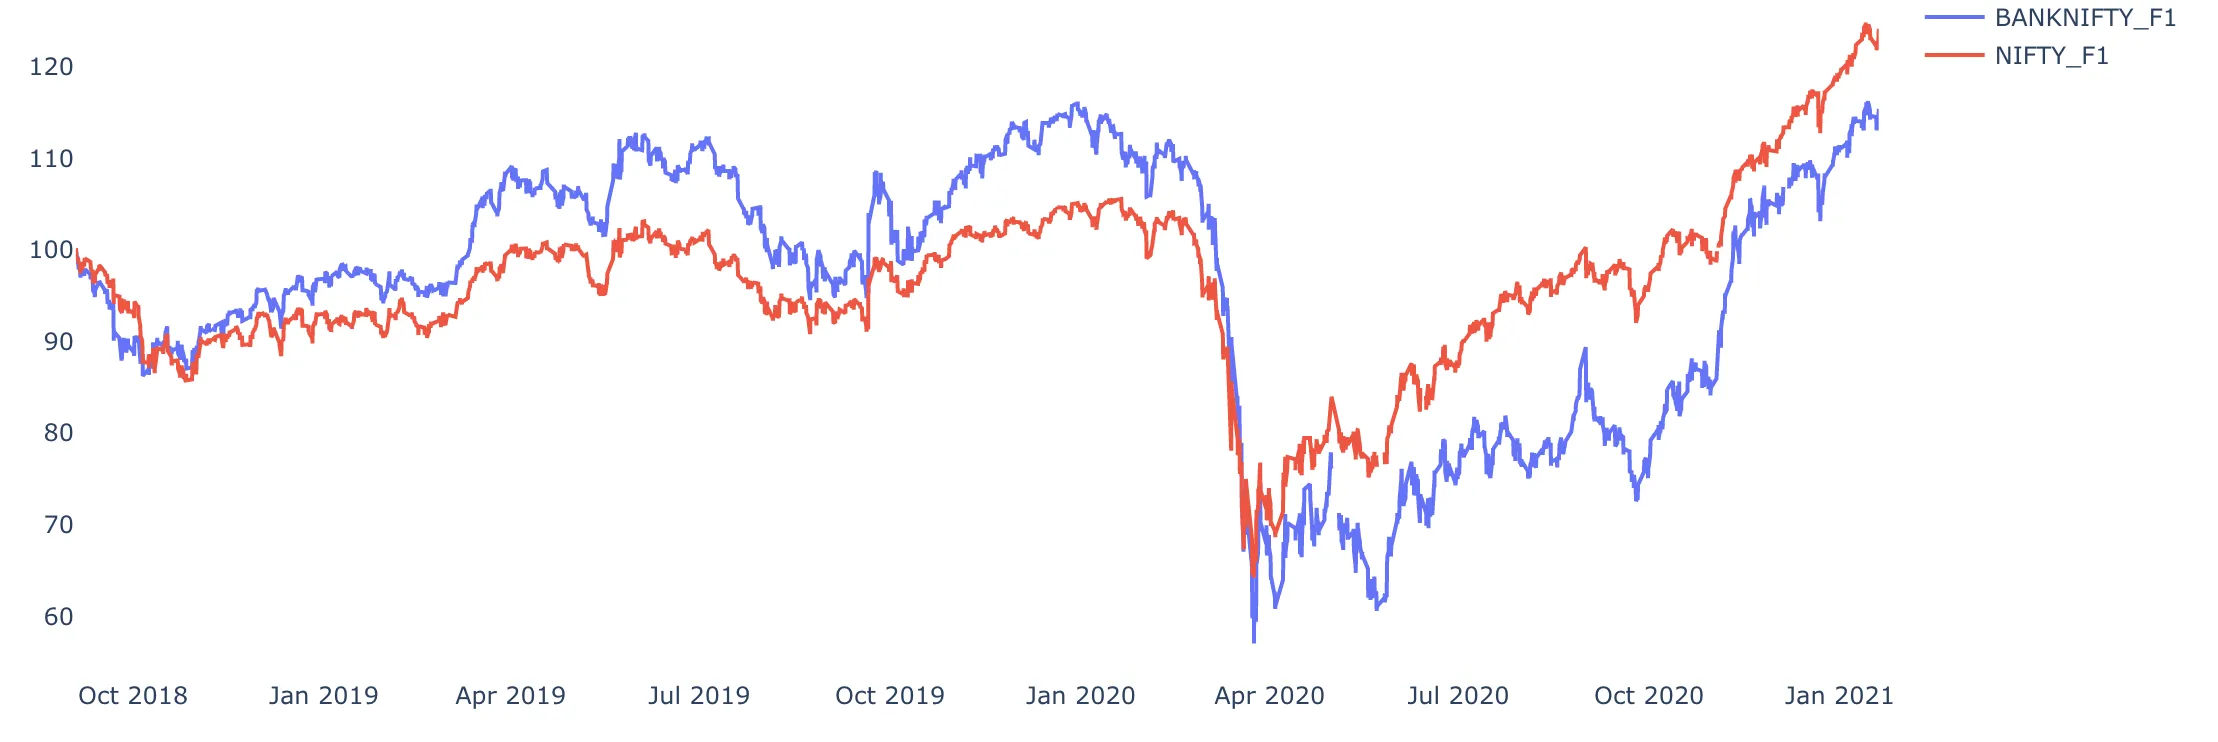
As the charts show, the two series are almost 80% correlated. But you not just want to look at the correlation but also at a statistic calledco-integrationbefore you take a pairs trade. A Co-integration test is used to establish a correlation between the time series in the long term.
A famous test for co-integration, the Engle-Granger method starts by creating residuals based on the static regression and then testing the residuals for unit-roots presence. It uses the Augmented Dickey-Fuller Test (ADF) or other tests to test stationarity in time series.
We used a standard co-integration using statmodels in python and saw that the two series are co-integrated. The next step is to find the stationary relation based on which we can take the pair trade.
A time series is stationary if its mean and variance are constant over time. Finding a stationary time series is critical to model mean reversion. Only with a stationary process can you confidently say that the values will return to their mean, and fluctuations around the mean will have roughly equal amplitudes.
If you look at the spread between the two time-series, just looking at it, you can confidently say that it is not mean-reverting or stationary.
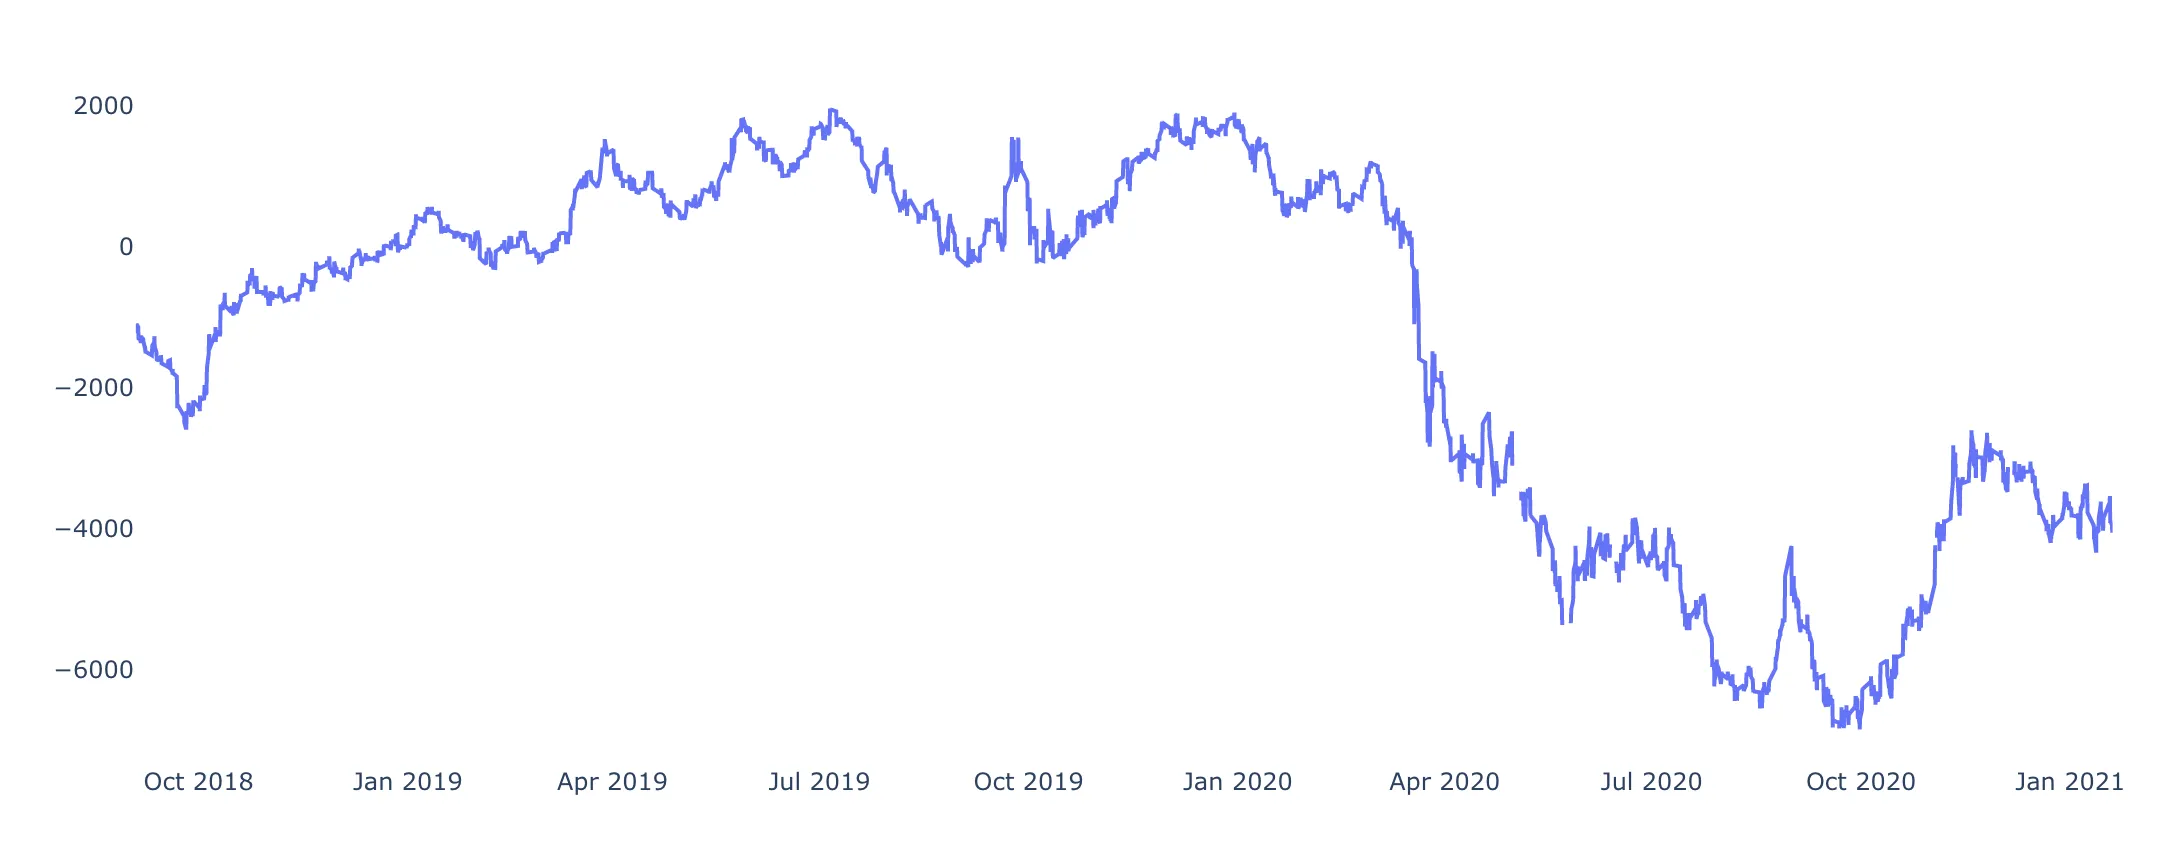
We, therefore, now need to work on our two time-series to a stationary relation based on which we can trade. We find that while the spread or the ratio of values is not stationary, the regression residuals between the two time-series are stationary.
The plot below the regression residuals between the two time-series can be easily recognized as a stationary relation. The Augmented Dickey-Fuller test for stationarity also detects stationarity in the residuals.
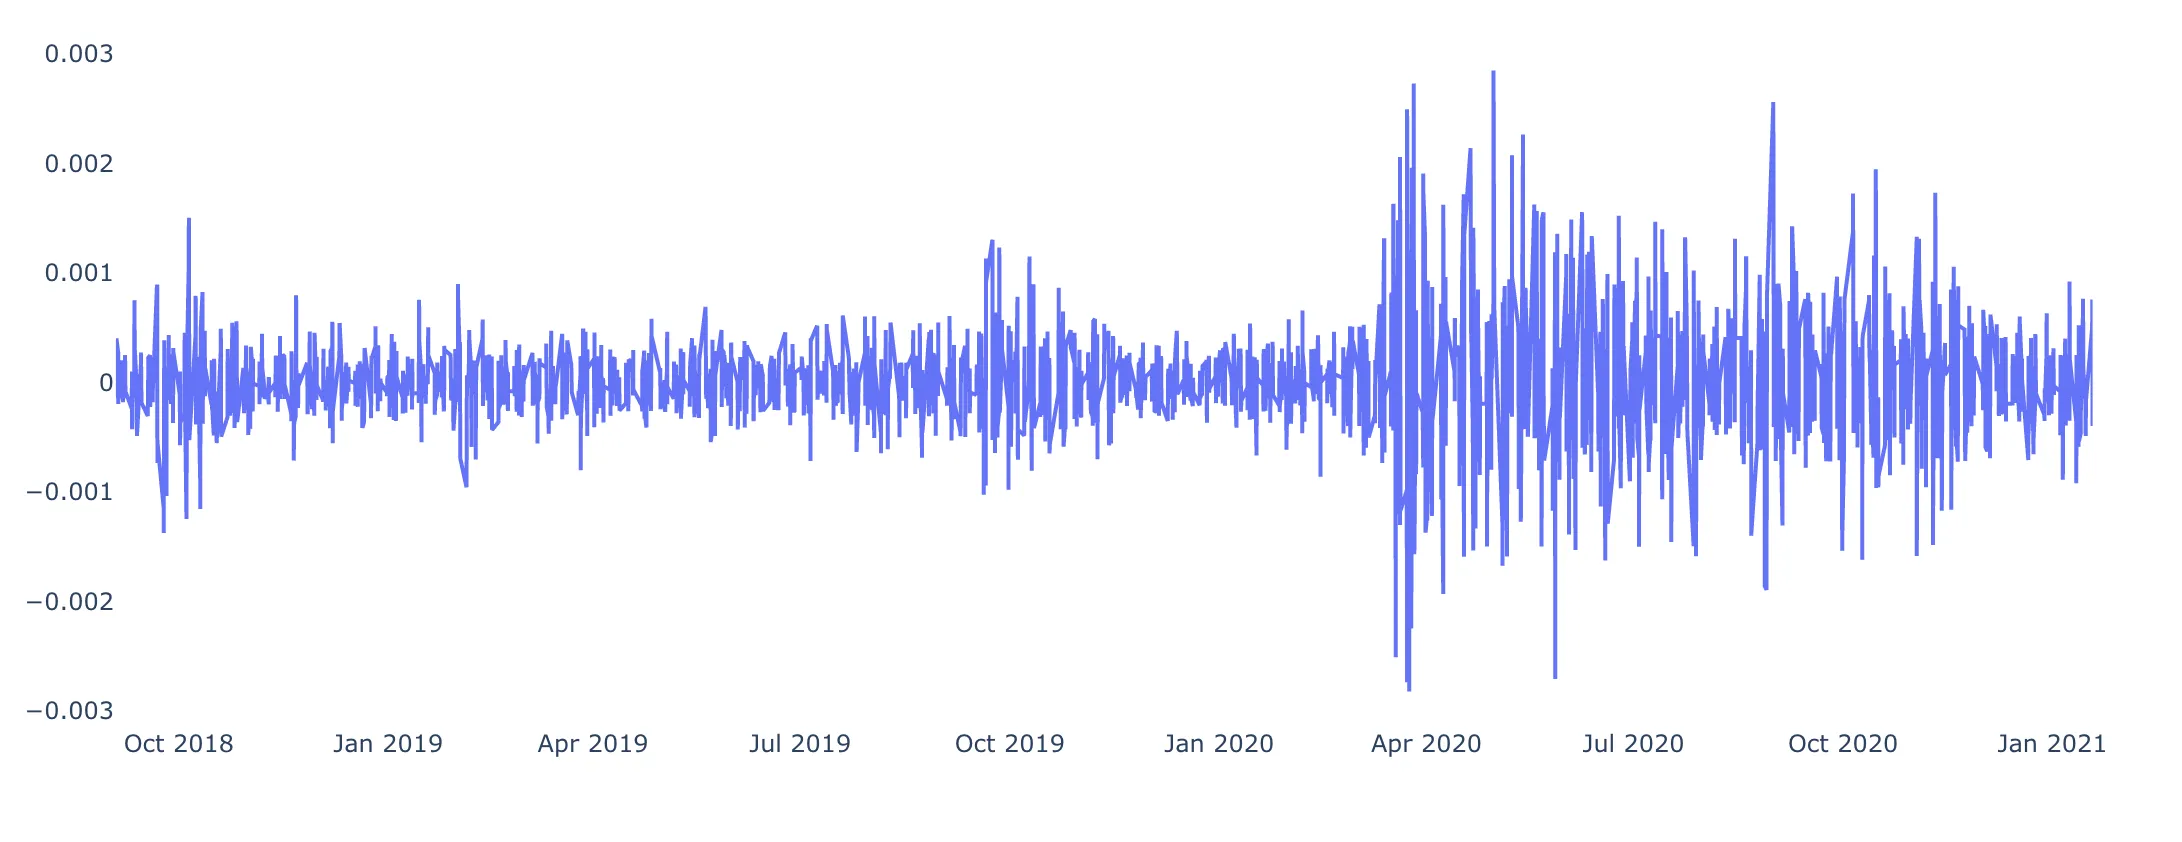
Having detected this stationary relation, we can confidently say that if the residual goes above or below a certain value, we can expect it to revert back to the mean.
If you’re interested in Pairs Trading, a Pair Trading Stock List can be an invaluable tool. This list includes stocks that typically move together due to being in the same industry or having similar market influences. Such correlation is exactly what a Pairs Trader looks for to execute successful trades.
Coca-Cola | PepsiCo |
Royal Dutch Shell | BP |
Walmart | Costco |
Amazon | Alibaba |
Visa | Mastercard |
Exxon Mobil | Chevron |
Ford | General Motors |
Such lists are often provided by trading platforms or financial websites, simplifying the process of identifying potentially correlated stocks. Utilizing a Pair Trading Stock List saves time and helps traders focus on executing their strategies effectively.
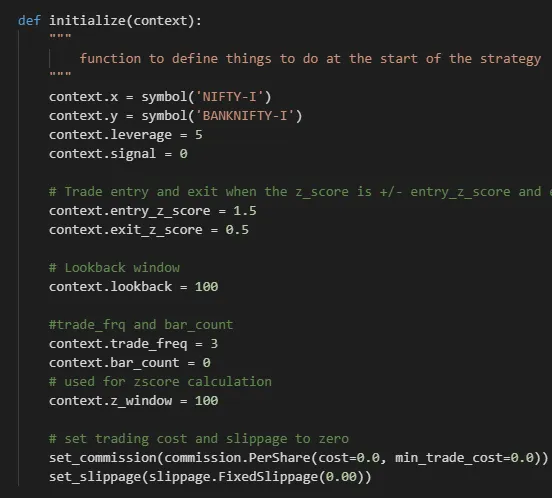
The implementation is done using the zipline API. The first step is creating the initialization function, which will define all the global variables. The set_commision and set_slippage functions are used to set transaction cost to zero.
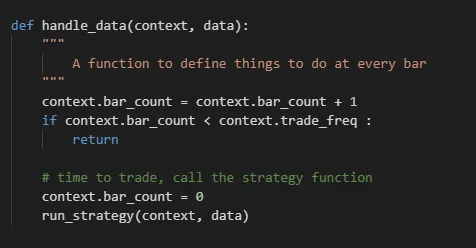
Then we define a function that will handle the incoming data every minute, as we are running and looking for a pairs trading opportunity as often as possible.
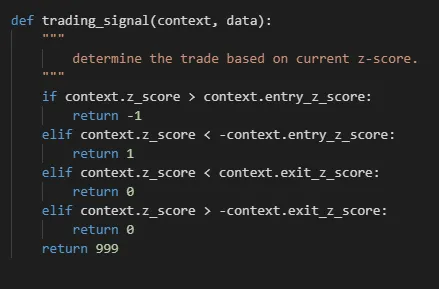
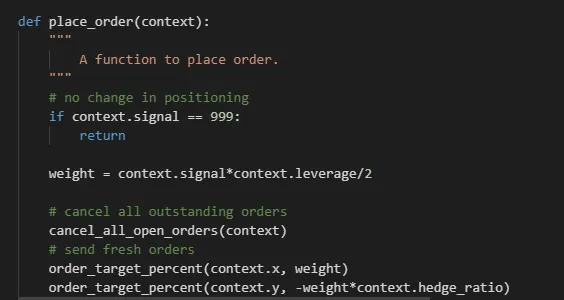
Now, we finally apply the model and look at trading signal and how we will place orders. For trading signal, we will buy the undervalued index and sell the overvalued index when the spread calculated is above 1.5 (positive or negative). We will empty our positions when the spread is below 0.5 (positive or negative). We will place orders on the weights depending on trading signal and a constant. Looking at trading_signal and place_order python functions everything in the paragraph becomes clear.
Now is the time for the results. Our implementation gave a fairly decent performance. We see that the returns using a leverage of 3.5 are 59% in the 3 year period and the Sharpe Ratio is 2.28. The drawdown is also quite low at -3%
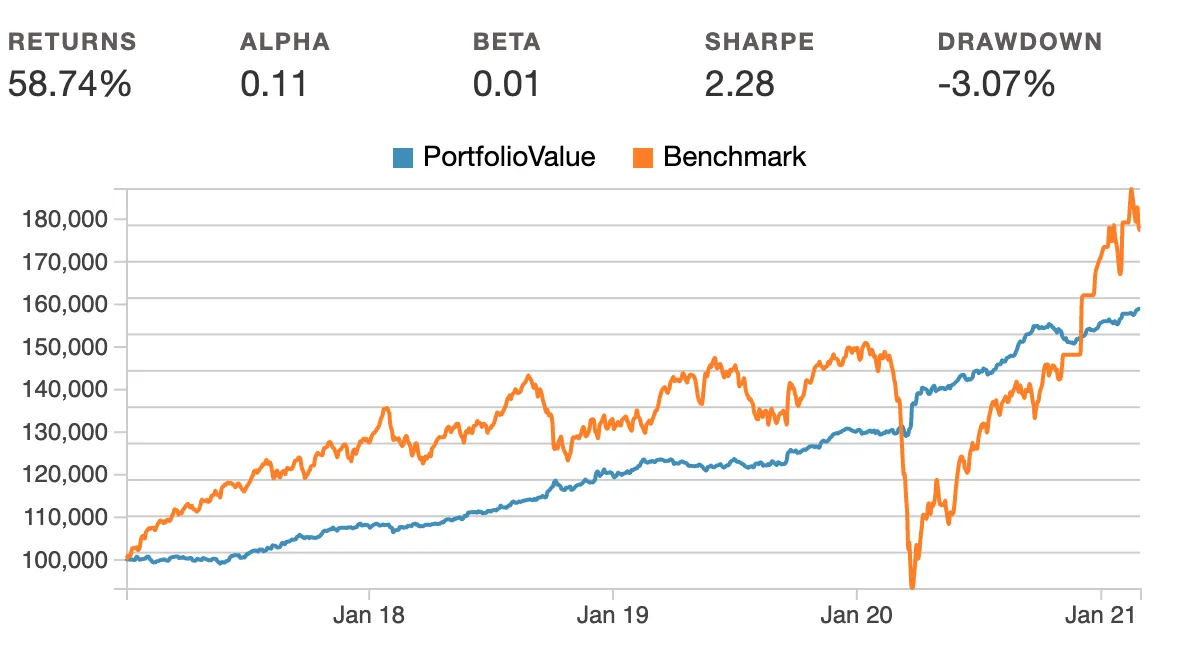
We can further improve our model by playing with the variables defined during initialization. As can be seen our results are promising to go live with. Pairs trading has always been seen as a lucrative statistical arbitrage strategy.
Also read the following interesting quant related articles
1. What are the key components of pair trading?
Pair selection, cointegration analysis, spread measurement, entry/exit signals, and risk management are the most important parts of pairs trading.
2. What criterial should I consider when selecting pairs for trading?
High historical correlation, similar sector or business, and stable cointegration are used to choose pairs.
3. What is entry and exit criteria for pairs trading?
Enter when spread diverges, exit at mean reversion or predefined thresholds.
4. How do I manage risks and determine position sizing for pairs trading?
Set a stop-loss, control your risk through trade sizing, and consider volatility.
5. What research and analysis techniques can I use for pairs trading?
Cointegration tests, correlation analysis, studying past data, and risk modeling are all ways to do research and analysis.
Discover investment portfolios that are designed for maximum returns at low risk.
Learn how we choose the right asset mix for your risk profile across all market conditions.
Get weekly market insights and facts right in your inbox
It depicts the actual and verifiable returns generated by the portfolios of SEBI registered entities. Live performance does not include any backtested data or claim and does not guarantee future returns.
By proceeding, you understand that investments are subjected to market risks and agree that returns shown on the platform were not used as an advertisement or promotion to influence your investment decisions.
"I was drawn to Wright Research due to its multi-factor approach. Their Balanced MFT is an excellent product."

By Prashant Sharma
CTO, Zydus
By signing up, you agree to our Terms and Privacy Policy
"I was drawn to Wright Research due to its multi-factor approach. Their Balanced MFT is an excellent product."

By Prashant Sharma
CTO, Zydus
Skip Password
By signing up, you agree to our Terms and Privacy Policy
"I was drawn to Wright Research due to its multi-factor approach. Their Balanced MFT is an excellent product."

By Prashant Sharma
CTO, Zydus
"I was drawn to Wright Research due to its multi-factor approach. Their Balanced MFT is an excellent product."

By Prashant Sharma
CTO, Zydus
Log in with Password →
By logging in, you agree to our Terms and Privacy Policy
"I was drawn to Wright Research due to its multi-factor approach. Their Balanced MFT is an excellent product."

By Prashant Sharma
CTO, Zydus
Log in with OTP →
By logging in, you agree to our Terms and Privacy Policy
"I was drawn to Wright Research due to its multi-factor approach. Their Balanced MFT is an excellent product."

By Prashant Sharma
CTO, Zydus
Answer these questions to get a personalized portfolio or skip to see trending portfolios.
Answer these questions to get a personalized portfolio or skip to see trending portfolios.
(You can choose multiple options)
Answer these questions to get a personalized portfolio or skip to see trending portfolios.
Answer these questions to get a personalized portfolio or skip to see trending portfolios.
Answer these questions to get a personalized portfolio or skip to see trending portfolios.
(You can choose multiple options)
Investor Profile Score
We've tailored Portfolio Management services for your profile.
View Recommended Portfolios Restart