by Sonam Srivastava
Published On Oct. 26, 2019
Time series is a topic I’ve seen a lot of data scientists run away from. There’s a widespread belief that time series is a complex topic with a variety of equations, hence rendering it a not-so-popular subject.
That’s a fallacy I want to break in this article. Knowing how time series modeling works and being able to utilize it opens up an incredible number of use cases! From being able to predict the price of a product to being able to read financial markets, time series modeling will enhance your data science skillset and portfolio.
We will talk about one such offshoot of time series modeling called Regime Shift Models in this article. We will first understand what regime shift models are and how they fit into the financial market space. We’ll then understand the different types of regime shift models before implementing one in Python.
Introduction to Regime Shift Models in Time Series
Regime Shift Modeling in Financial Markets
Types of Regime Shift Models
Markov Switching Autoregressive Model
Implementing a Markov Switching Autoregressive Model in Python
In the realm of time series analysis, Regime Shift Models emerge as a sophisticated tool designed to address the limitations inherent in traditional linear autoregressive models. Unlike conventional models that assume a constant behavior throughout the entire time period, Regime Shift Models recognize and adapt to the dynamic nature of time series data. This section aims to provide a comprehensive understanding of what Regime Shift Models entail and how they play a pivotal role, particularly in the context of financial markets.
At its core, a Regime Shift Model acknowledges that a time series can exist in different "states," each characterized by its unique set of statistical properties. These states represent distinct periods in which the behavior of the data undergoes significant changes. The transition from one state to another is governed by specific processes or variables, reflecting shifts triggered by fundamental changes in macroeconomic variables, policies, or regulations.
The fundamental departure from traditional models lies in the adaptability of Regime Shift Models. In financial markets, where abrupt changes in behavior are commonplace, these models shine. They can discern when the mean, variance, or correlation patterns of stocks undergo substantial shifts, providing a more realistic representation of market dynamics. This adaptability is particularly valuable for investors and traders who need to adjust their strategies based on the prevailing market regime.
For participants in financial markets, understanding and leveraging Regime Shift Models is crucial. Systematic investors can benefit from adapting their trading styles and selecting instruments based on prevailing market regimes, aiming for consistent performance. Active traders can optimize stop-loss limits and choose technical indicators tailored to specific market conditions. Recognizing the importance of distinguishing between market states, Regime Shift Models become valuable tools for navigating the complexities of financial landscapes.
While Regime Shift Models offer a sophisticated framework for understanding the dynamic nature of time series data, it's essential to recognize that they come with their set of challenges and limitations. This section delves into the practical constraints and potential hurdles associated with implementing Regime Shift Models, providing a nuanced understanding of their drawbacks.
One of the primary challenges with Regime Shift Models lies in managing the transitions between different states. While these transitions capture essential shifts in the behavior of time series data, they introduce complexities in terms of modeling and analysis. Identifying the exact points at which a regime shift occurs and accurately characterizing the properties of each state require a high degree of precision, making the modeling process intricate.
Regime Shift Models, despite their adaptability, are not immune to inaccuracies. Predicting precisely when a regime shift will happen and the characteristics of the ensuing state involves uncertainties. External factors, unexpected events, or abrupt market reactions can introduce noise, impacting the accuracy of the model's predictions. Striking a balance between model complexity and predictive accuracy is an ongoing challenge in the development and application of Regime Shift Models.
The effectiveness of Regime Shift Models is highly sensitive to the quality and relevance of the data used for calibration. Incomplete or noisy datasets can lead to suboptimal model performance. Achieving a robust calibration that generalizes well to different market conditions is a persistent challenge. Moreover, model calibration may require continuous adjustments to accommodate evolving market dynamics, adding a layer of complexity to their practical implementation.
As Regime Shift Models involve complex statistical processes, their interpretability may be challenging. Understanding the reasoning behind a particular regime classification or the factors influencing transitions demands a certain level of expertise. This lack of transparency can pose challenges, especially for stakeholders who may not have a deep statistical background.
Implementing Regime Shift Models, especially in real-time scenarios with vast datasets, can be computationally intensive. The need for sophisticated algorithms and considerable computational resources may limit the feasibility of these models for certain applications.
While Regime Shift Models offer a valuable framework for capturing the intricacies of time series data, acknowledging and navigating their challenges is crucial. From the intricacies of handling state transitions to the inherent uncertainties in predicting regime shifts accurately, understanding the limitations ensures a more realistic expectation of what these models can achieve in practice.
Time series modeling is widely used for sequential, serially correlated data like modeling stock prices, analyzing business performance for the next quarter, weather forecasting, signal processing, etc.
A time series is a series of data points indexed (or listed or graphed) in time order. Most commonly, a time series is a sequence taken at successive equally spaced points in time. A quick Google search shows us the sheer number of resources available for time series analysis (finding a meaningful statistic on time series data) and time series forecasting (predicting future values based on past values).
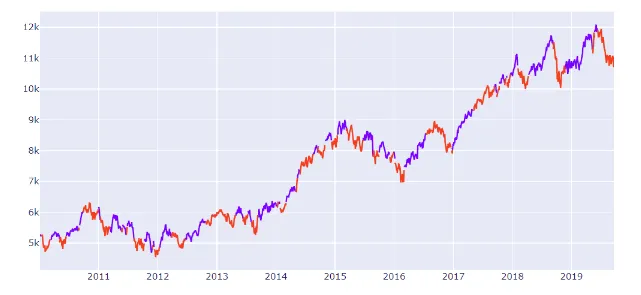 Time Series of Nifty prices with marked Regimes
The simplest approach for time series modeling is the linear autoregressive model.
The autoregressive model specifies that the output variable depends linearly on its own previous values and on a stochastic term (an imperfectly predictable term).
To put this in an equation:
Rt=μ+ β×Rt-1+ σϵ
The stock price has a constant intercept (mean value), slope against previous value, and error term related to variance.
This approach assumes that the characteristics of the time series (mean and variance) stay the same during the whole time period under consideration but that is usually not the case. A time series can change behavior completely from one period to the next due to some structural changes. For example, a stock price series can change its behavior drastically from trending to volatile after a policy or macroeconomic shock.
Regime shift models address this gap in basic time series modelling by segregating the time series into different “states”. These models are also widely known as state-space models in time series literature.
In this article, we will look at the use case of such models for modeling stock prices.
Financial markets can change their behavior abruptly. The behavior of stock prices from one period to the next can be drastically different. So many people try to play the market and fail spectacularly – I’m sure you’ve read about a few examples in the news.
When trying to model these prices, we can see that the mean, variance and correlation patterns of stocks can vary dramatically. This, in financial markets, is usually triggered by fundamental changes in macroeconomic variables, policies or regulations.

For financial models, these models are of immense importance as someone participating systematically in the financial market needs to adapt their trading style and choice of instruments based on the market regimes to get a consistent performance. Choosing the right set of assets or sectors in a particular regime can provide significant alpha to a systematic investor. Similarly, for active traders, the optimal stop-loss limits and the choice of technical indicators can vary from one regime to another.
In this article, we will focus more on the modeling aspects of these time series models.
Regime shift models are also called state-space models or dynamic linear models in time series modeling nomenclature.
The idea here is that time series exists in two or more states, each characterized by their own probability distributions, and the transition of one state to another is governed by another process or variable.
There are three types of models that are popularly used:
Threshold models
Predictive models
Markov switching autoregressive models
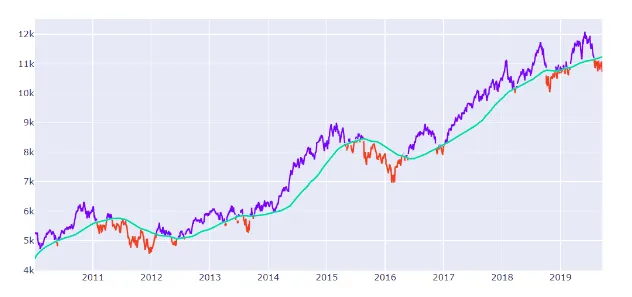
An observed variable crossing a threshold triggers a regime shift. For example, the prices moving below the 200-day moving average trigger a ‘bearish regime’ or a downtrend. This can be visualized by looking at the chart of Nifty and the 200-day moving average below:
Data scientists can use prediction methods like machine learning algorithms to take macroeconomic variables like GDP, unemployment, long term trends, bond yields, trade balance, etc. as input and predict the next period risk.
When the model predicts a high-risk number, the market is in a risky regime. When the model predicts a low-risk number, the market is in a trending regime.
These models assume the regime to be a ‘hidden state’ whose probability and characteristics are estimated using maximum likelihood estimation. We will look into the details of these models below.
The steady-state equation of an asset price is defined as an autoregressive process. This is characterized by the intercept 𝜇, autocorrelation β, and volatility 𝜎, of the process specific to the market regime
Rt=μ+ β×Rt-1+ σϵ
The governing dynamics of the underlying regime, 𝑆𝑡, are assumed to follow a homogenous first-order Markov chain. Here, the probability of the next state depends only on the present state.
We can estimate the transition probabilities from one such state to the next through a Maximum Likelihood Estimator. This attempts to find the parameter values that maximize the likelihood function.
Let’s get our hands on some Python code! We will implement a three-state variance Markov switching model for modeling risk regime on the NIFTY Index here. You can download the dataset we’ll be using from here.
Let’s begin! First, we will import the required libraries and get the returns:
import pandas as pd
import statsmodels.api as sm
from statsmodels.tsa.stattools import adfuller
import matplotlib.pyplot as plt
nifty = pd.read_csv('nifty.csv', index_col=0, parse_dates=True #Get nifty prices
nifty_ret = nifty.resample('W').last().pct_change().dropna() #Get weekly returns
nifty_ret.plot(title='Excess returns', figsize=(12, 3)) #Plot the dataset

Next, we will check for stationarity:
adfuller(nifty_ret.dropna())
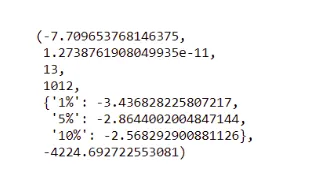
We can see that the series is stationary (as the p-value of the ADFuller test is close to 0) and the model can be fit on it.
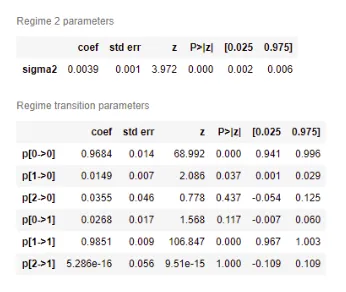
We will now use statsmodels to model 3 variance regimes in Nifty:
#Fit the model
mod_kns = sm.tsa.MarkovRegression(nifty_ret.dropna(), k_regimes=3, trend='nc', switching_variance=True)
res_kns = mod_kns.fit()
res_kns.summary()
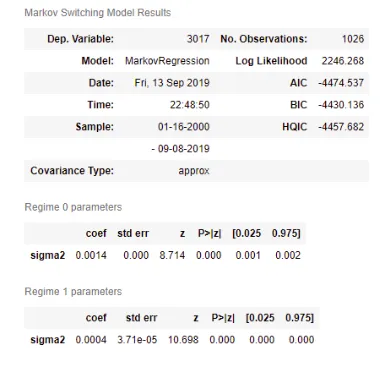
Let’s plot the smoothed probabilities of the regimes:
fig, axes = plt.subplots(3, figsize=(10,7))ax = axes[0]
ax.plot(res_kns.smoothed_marginal_probabilities[0])
ax.set(title='Smoothed probability of a low-variance regime for stock returns')ax = axes[1]
ax.plot(res_kns.smoothed_marginal_probabilities[1])
ax.set(title='Smoothed probability of a medium-variance regime for stock returns')ax = axes[2]
ax.plot(res_kns.smoothed_marginal_probabilities[2])
ax.set(title='Smoothed probability of a high-variance regime for stock returns')fig.tight_layout()
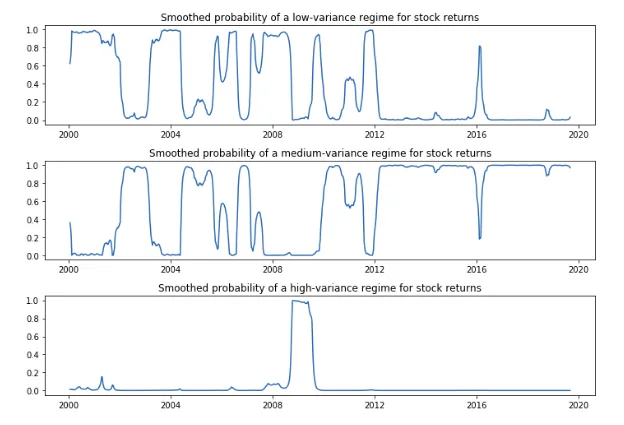
Perfect! We can now use the trained model to forecast the next period state or “regime” to make use of the specific time series model.
The landscape of data science and time series modeling is ever-evolving, and the future holds promising trends for the realm of Regime Shift Analysis. Anticipating advancements and innovations is crucial for staying at the forefront of analytical capabilities. Let's delve into the potential future trends that could shape the trajectory of Regime Shift Analysis.
As the sophistication of algorithms continues to surge, future Regime Shift Models are likely to benefit from cutting-edge approaches. Deep learning integration stands out as a key area of exploration. By leveraging neural networks and advanced pattern recognition, these models could become more adept at capturing intricate relationships within time series data. Enhanced adaptability to complex data structures may be a focal point, ensuring that Regime Shift Models remain robust in the face of diverse and dynamic datasets.
The synergy between Regime Shift Models and machine learning is an exciting frontier. Future trends may witness a seamless integration of machine learning techniques to augment the predictive capabilities of Regime Shift Analysis. Machine learning algorithms, fueled by vast datasets and sophisticated learning methodologies, could contribute to more accurate and nuanced predictions of regime shifts. This integration might pave the way for comprehensive analyses that consider a broader spectrum of factors influencing market dynamics.
Precision in predicting regime shifts is paramount, and future trends in Regime Shift Analysis are likely to concentrate on refining predictive precision. Innovations in data preprocessing, feature engineering, and state transition modeling could contribute to sharper and more reliable predictions. Whether through the development of novel statistical methodologies or the incorporation of advanced mathematical techniques, the focus will be on elevating the accuracy of forecasts, providing practitioners with more confidence in decision-making.
These future trends collectively underscore the dynamic nature of Regime Shift Analysis and its adaptability to emerging technologies and methodologies. As data science continues to evolve, Regime Shift Models are poised to become more sophisticated, versatile, and effective in unraveling the complexities of time series data, particularly in the context of financial markets. Stay tuned for these exciting advancements that will likely redefine the landscape of Regime Shift Analysis in the years to come.
Understanding the theoretical underpinnings of Regime Shift Models is a crucial first step, but the true value of these models manifests when applied to real-world scenarios.
One of the primary applications of Regime Shift Models lies in modeling stock prices. Financial markets are dynamic, and stock prices often exhibit varying behaviors influenced by fundamental changes, economic policies, and external shocks. Regime Shift Models excel in capturing these shifts by categorizing the data into different states, each with its distinct characteristics. By identifying the regimes, investors and analysts can gain insights into the underlying market conditions, facilitating a more informed analysis of stock price movements.
Regime Shift Models provide a valuable tool for strategic decision-making in financial markets. Investors and fund managers can leverage these models to adapt their trading strategies based on the prevailing market regimes. For example, during periods of high volatility, a conservative investment approach might be warranted, while trending markets could encourage a more aggressive strategy. The ability to align investment decisions with the current market regime enhances the potential for generating alpha and managing risk effectively.
Regime Shift Models contribute to optimal portfolio allocation and diversification. As different asset classes and sectors may perform differently in distinct market regimes, understanding these shifts allows investors to allocate resources strategically. By identifying sectors likely to outperform in a specific regime, investors can enhance portfolio returns and manage risks more effectively. This dynamic approach to portfolio management aligns with the ever-changing nature of financial markets.
Effective risk management is a cornerstone of successful investing. Regime Shift Models play a vital role in risk management strategies by providing insights into the potential shifts in market conditions. Investors can adjust their risk tolerance and exposure based on the identified regimes, implementing tailored risk management approaches for different market environments. This adaptability is particularly valuable during uncertain economic periods or unexpected events that may trigger regime shifts.
Regime Shift Models empower traders with adaptive strategies. Traders can adjust their tactics, such as stop-loss limits and the choice of technical indicators, based on the identified market regime. This flexibility enables traders to navigate different market conditions more effectively, potentially improving trading performance.
In essence, the practical applications of Regime Shift Models extend beyond theoretical concepts, offering tangible benefits for investors, fund managers, and traders. Whether in modeling stock prices, guiding strategic decisions, optimizing portfolio allocation, managing risks, or shaping adaptive trading strategies, these models contribute to a more nuanced and informed approach to navigating the complexities of financial markets.
We saw a simple regime shift model at play in this article. With such a model in place that can forecast the next period risk based on present market conditions, we can take a much more informed bet in the financial markets and adapt our risk appetite accordingly. Such models are a very important building block of an adaptive trading strategy.
I encourage you to go ahead and play around with the code above. You can use a bigger Nifty sample as well. Let me know how it works out for you in the comments section below!
What is an example of a regime shift?
Example: The transition from a bull market to a bear market in financial markets, where there's a significant and sustained change in investor sentiment and market behavior.
Who created regime theory?
Regime theory has contributions from various scholars, but it's associated with International Relations. The concept was developed by Stephen Krasner, Robert Keohane, and Joseph Nye in the late 20th century.
What are the elements of regime theory?
Elements include international institutions, norms, principles, and rules that guide state behavior in the international system. It focuses on cooperation, coordination, and the impact of shared expectations among states.
What is regime analysis?
Regime analysis involves studying the structures, rules, and norms that govern a specific area, such as international relations, environmental policies, or financial markets. It examines the functioning of systems and the impact of changes on outcomes.
How regime shift models are applied in different industries?
Regime shift models are applied in various industries, including finance, environmental science, and economics. In finance, they help predict market behavior shifts. In environmental science, they analyze changes in ecosystems. In economics, they study shifts in economic policy or market dynamics. The models aid in understanding and adapting to changing conditions in these diverse fields.
Discover investment portfolios that are designed for maximum returns at low risk.
Learn how we choose the right asset mix for your risk profile across all market conditions.
Get weekly market insights and facts right in your inbox
It depicts the actual and verifiable returns generated by the portfolios of SEBI registered entities. Live performance does not include any backtested data or claim and does not guarantee future returns.
By proceeding, you understand that investments are subjected to market risks and agree that returns shown on the platform were not used as an advertisement or promotion to influence your investment decisions.
"I was drawn to Wright Research due to its multi-factor approach. Their Balanced MFT is an excellent product."

By Prashant Sharma
CTO, Zydus
By signing up, you agree to our Terms and Privacy Policy
"I was drawn to Wright Research due to its multi-factor approach. Their Balanced MFT is an excellent product."

By Prashant Sharma
CTO, Zydus
Skip Password
By signing up, you agree to our Terms and Privacy Policy
"I was drawn to Wright Research due to its multi-factor approach. Their Balanced MFT is an excellent product."

By Prashant Sharma
CTO, Zydus
"I was drawn to Wright Research due to its multi-factor approach. Their Balanced MFT is an excellent product."

By Prashant Sharma
CTO, Zydus
Log in with Password →
By logging in, you agree to our Terms and Privacy Policy
"I was drawn to Wright Research due to its multi-factor approach. Their Balanced MFT is an excellent product."

By Prashant Sharma
CTO, Zydus
Log in with OTP →
By logging in, you agree to our Terms and Privacy Policy
"I was drawn to Wright Research due to its multi-factor approach. Their Balanced MFT is an excellent product."

By Prashant Sharma
CTO, Zydus
Answer these questions to get a personalized portfolio or skip to see trending portfolios.
Answer these questions to get a personalized portfolio or skip to see trending portfolios.
(You can choose multiple options)
Answer these questions to get a personalized portfolio or skip to see trending portfolios.
Answer these questions to get a personalized portfolio or skip to see trending portfolios.
Answer these questions to get a personalized portfolio or skip to see trending portfolios.
(You can choose multiple options)
Investor Profile Score
We've tailored Portfolio Management services for your profile.
View Recommended Portfolios Restart