by BG
Published On Dec. 3, 2024
The Indian share market is a very intricate and complex system, which is why investors need the right kind of tools and indicators to go through it. One such indicator is the moving average. It gives an understanding of the market trend. It smooths out price data to give a constantly updated average price, giving a better view of the market movement. But what exactly is this moving average, and how to use moving averages to understand the sound analysis of the market?
The moving average indicator is a filter that removes the noise from the daily price oscillations and reveals the underlying trend in prices. This has the effect of smoothing, where support and resistance levels, or even potential trend reversals and direction of the market, becomes easier to identify. Knowing the meaning of moving averages and their numerous applications can be very helpful both for experienced and inexperienced investors in the Indian share market.
In a nutshell, it is a form of statistical calculation meant to be used in analyzing data points based on a particular period whereby, in the end, a trend line is generated. Applying this principle to the share market in its data forms represents prices for a security. Since a moving average is an indication of the average price movement in the plot of share market charts, investors can determine the direction of a trend. The moving average strategy relies on smoothing price volatility so that the underlying trend is clearer; making it easier to spot their buy or sell signals.
Calculating the moving average is done by the addition of closing prices of a security over a specified number of periods then divided by the number of periods. It is repeated for each next period when the oldest data point is omitted and the newest is added. The result produces a "moving" average line. For example, the formula for simple moving average is a direct computation of the average price over a defined period. Knowing what is a moving average and how it's calculated will empower investors to interpret its signals effectively and make trading decisions accordingly.
Although the essence of the core concept is constant, different moving averages exist. Two of the popular moving averages used in technical analysis are SMA and EMA. SMA stands for Simple moving average and just like its name it is a simple average of price data over any specified period. With equal weighting on every data point.
On the other hand, EMA places more emphasis on the recent price data thus reacting fast to the recent changes in price. This makes EMA a preferable indicator to many traders who are targeting short-term price movements and reacting rapidly to changes in market trends. Both SMA and EMA have their strengths and weaknesses, and the choice between them mainly depends on the moving average trading strategy one uses and the preference of a trader.
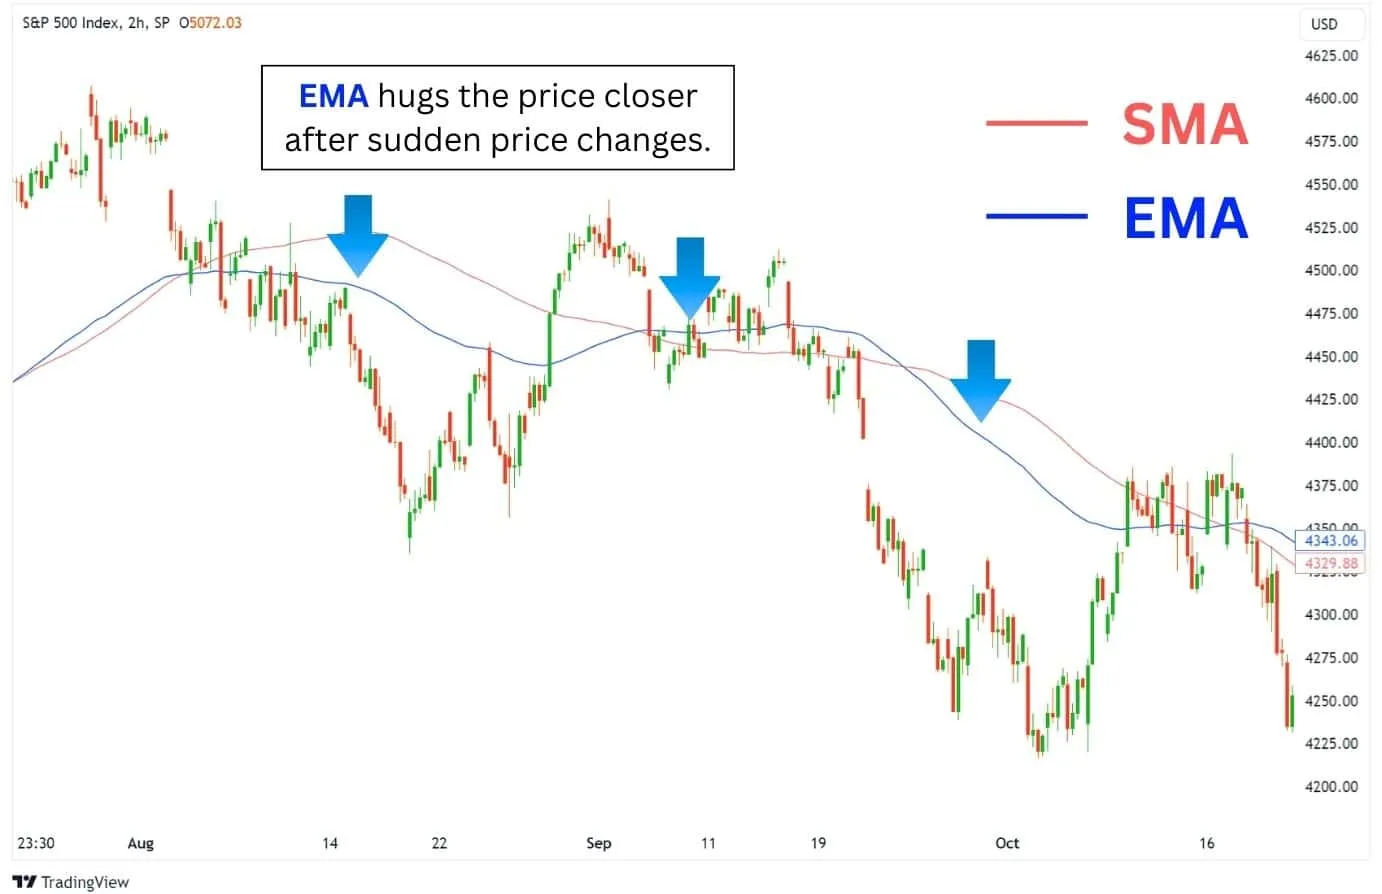
This would help in distinguishing the different types of moving average indicators and how these should be analyzed. An SMA gives smoother trend lines, but an EMA offers quicker signals into any potential shift in trends. Bringing both into one's analysis may potentially show more all-inclusive views regarding markets and make better decisions on trading.
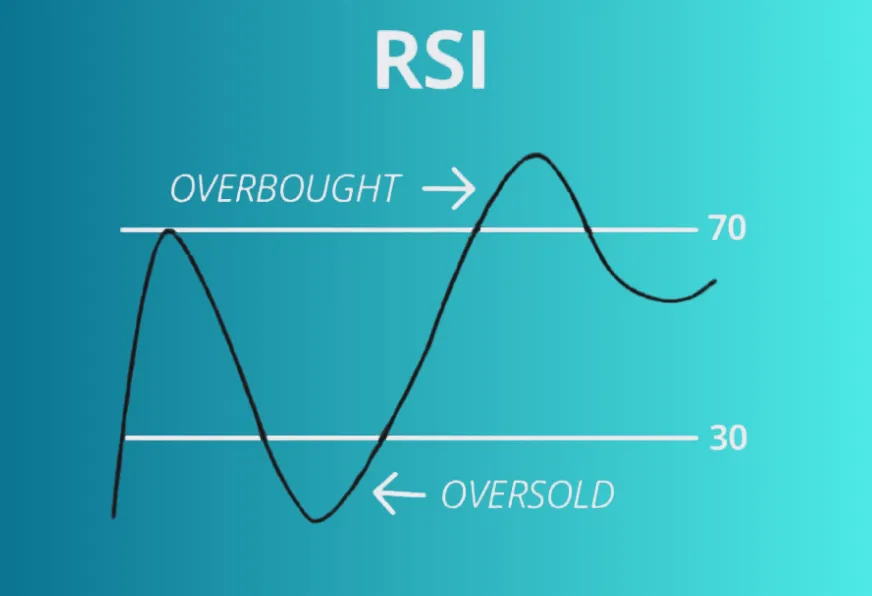
Moving average indicators are not merely lines plotted on a chart but come into their full strength when used in trading strategies. One of the popular moving average strategies emphasizes identifying crossovers, that is, when a shorter-term MA, say 20-day crosses above or below a longer-term MA, say 50-day. A bullish crossover is when the short-term MA breaks upwards, indicating a possible uptrend in the moving average in a share market. To confirm such a signal and to measure how strong the trend is, traders often use other indicators including the Relative Strength Index, or RSI .
Other than crossover techniques, moving averages can help determine dynamic support and resistance levels. For example, with an uptrend, the rising moving average acts as a support because it will not let the price drop sharply. Conversely, a falling MA in the other direction thus acts as resistance to the falling trend. The Average Directional Index, combined with this moving average approach, helps traders determine the strength of the trend while validating any suspected trading signals.
Moving Average Convergence Divergence is the extension of moving averages. The MACD is a very popular moving average indicator, a momentum oscillator that depicts the relationship between two EMAs of prices. It is calculated by subtracting the 26-period EMA from the 12-period EMA. The resulting value is plotted as a line oscillating around a zero line.
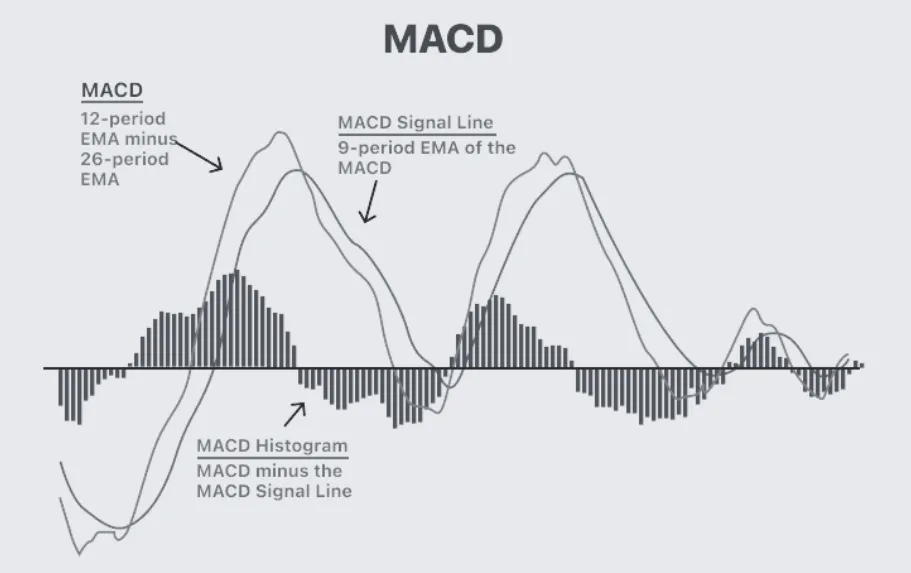
One of the components of the MACD is a signal line, which is a 9-period EMA of the MACD line. These lines crossing one another create a trading signal. The MACD also features a histogram that plots the difference between the MACD line and the signal line, offering visual clues regarding the strength and momentum of the trend.
Moving averages is a very important tool to the traders and analysts. It helps smoothen the price data by removing the volatility involved in the data and thus makes it much easier to trace the underlying trends and patterns providing a clearer view of the overall direction of the market.
In addition, moving averages act as good benchmarks for determining the potential support and resistance levels. These levels help the trader to enter and exit the market and handle risk in a better way to optimize the moving average trading strategy. A good understanding of what is moving average and its applications will help investors interpret market signals with more confidence and move ahead in the complexities of financial markets.
While moving averages have a wide range of applications in technical analysis, the most important application of long-term trends is represented by the 200-day MA. It is often considered the principal indicator for measuring the market trend. The 200-day MA is considered the benchmark line for many traders and analysts. A price trading above the 200-day MA consistently is often interpreted as bullish, and a price trading below the 200-day MA consistently is seen as bearish.
The 200-day moving average is a good filter for the long-term investor to catch already established trends and not get caught up in the noise of the daily market trading. It can also be used in conjunction with other moving average strategies and indicators to confirm trend reversals and make more informed investment decisions. Investors gain a wider view of the market by incorporating the 200-day MA into their analysis, thus aligning their strategies with the current long-term trend.
Moving averages are powerful tools with its own set of advantages and disadvantages. Understanding both sides helps in effectively incorporating it in your moving average analysis.
Trend Identification: Moving average indicators are excellent at smoothing price volatility, which enables an easy identification of the current trend in the share market. The greater clarity allows traders to make good decisions about their moving average trading strategy.
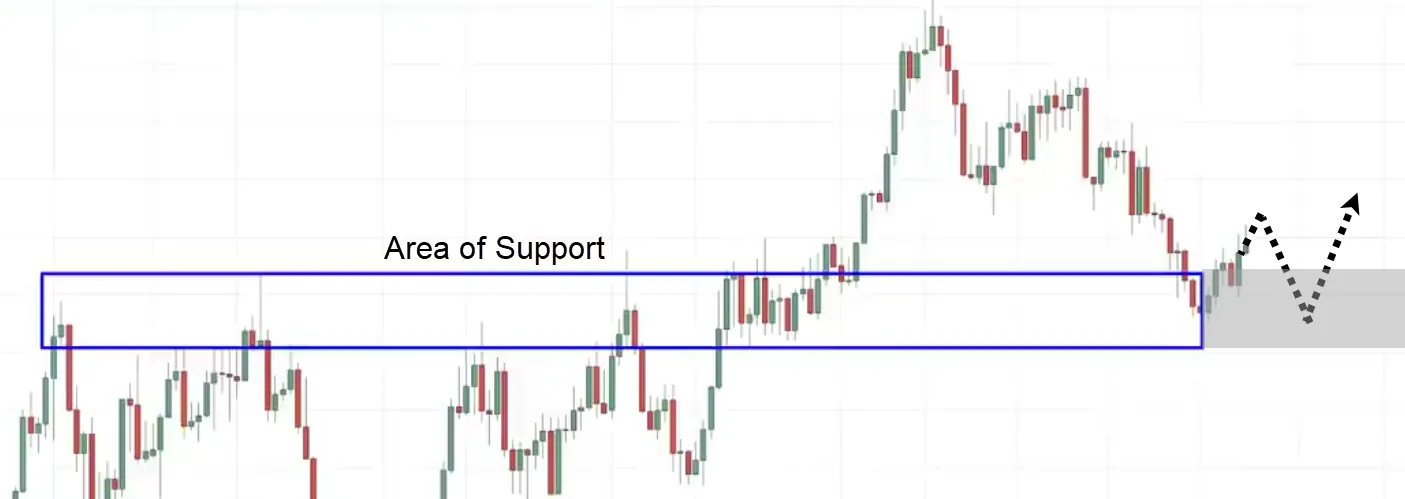
Support and Resistance: Moving averages are often regarded as dynamic support and resistance. When the trend is positive, the MA supports by resisting the price from moving much lower. On the contrary, when the trend is negative, the MA serves as a resistance.
Objective Interpretation: Instead of subjective interpretations made using charts, moving averages can help the trader to objectively look into the price trend with an absolute number. This is able to reduce the amount of emotions in trading decisions.
Versatility: They can be used across different timeframes-from short-term intraday trading to long-term investing-making them adaptable to various moving average strategies.
Lagging Indicator: Moving averages are based on past price data, meaning they react to price changes with a delay. This lag can sometimes result in missed opportunities or delayed entry and exit points.
False Signals: In choppy or sideways markets, moving averages often produce false signals, so that a trader believes that the trend is reversing when it is not.
Not a Standalone Tool: Relying solely on moving average indicators can be dangerous. Moving averages need to be used in combination with other technical indicators and fundamental analysis for an all-rounded view of the market.
Let's see how moving averages work with the following examples:
Imagine a stock price trading always above its 50-day moving average. The price could drop to the MA and bounce back. That will be interpreted as a bullish trend, where the 50-day MA acts as dynamic support. The information might be used in opening a long position or adding in to the positions already open in an open lot.
If a 20-day MA crosses over a 50-day MA, this is called a bullish crossover, which can be interpreted as an indication that the trend might be ready to reverse from bearish to bullish. Confirmation of that would require a trader to look for increased trading volumes or a confluence bullish signal from another indicator, like the RSI. If such confirmations are in place it will further fortify the case for a bullish reversal of the trend.
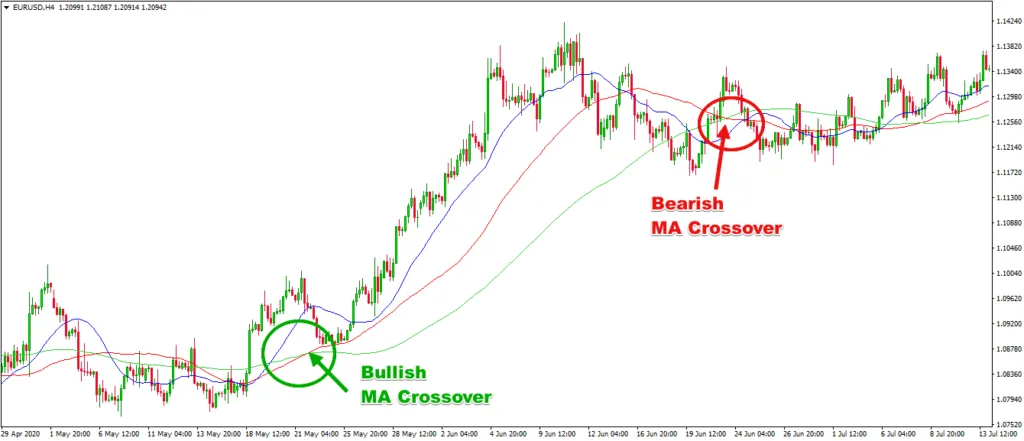
(Note: These are simplified examples. Real-world trading involves the analysis of multiple factors and indicators.)
Accessing and using moving averages is streamlined across various charting platforms and software. Such platforms make investors able to plot moving average indicators on price charts, customize periods, and combine them with other technical indicators for complete market analysis. A couple of the most popular ones follow:
TradingView: Friendly interface and more advanced features of charting make it great for trading since users are able to plot various forms of moving averages and personalize their parameters and carry out very extensive analysis on moving averages. It even gives some drawing tools and indicators to accompany your moving average strategy.
Zerodha Kite: This has to be one of the most widely used platforms in India with smooth trading and in-built charting tools. This way users can simply add moving averages to charts, change the periods and then use these moving averages to identify the trend or the share market where some action could take place.
Angel One: Angel One trading platform offers a wide suite of charting tools, and among them are different kinds of moving averages. In this way, investors can use the different tools to analyze price trends and identify support and resistance levels in moving average trading strategies.
While we have only discussed moving averages so far in relation to the analysis of stock prices, their utility goes much further than that. Here are a few other uses of this versatile tool:
Analyzing Major Indices: Major indices can be analyzed by taking moving averages on leading market indices such as Nifty 50 or Sensex so that the overall market sentiment is grasped along with changes in the share market.
Volume Analysis: Since moving averages can also be applied to trading volumes data, one can distinguish among periods of high volume as opposed to low volume-a potential goldmine for trend strength analyses.
Commodity Trading: Sometimes, commodity markets often find the application of the use of moving averages in making general price trend analyses, mostly done by specialists in gold, oil crude, and agricultural-based markets.
Forex Trading: Moving averages are an ideal tool to analyze currency pair trends and thus aid a trader in taking appropriate decisions on trading.
Moving averages have various applications that make it a basic requirement for any investor wishing to gain an understanding and grasp the dynamics of financial markets. You could be tracking stocks, indices, commodities, or even currencies-moving average analysis makes all these different aspects even more comprehensive for decision making.
A very straightforward tool any investor would carry is moving averages. That provides clarity and great insight in otherwise complex financial markets: for identifying trends and support/ resistance levels to effective strategies in trading, all from learning what a moving average and all its diverse applications might be.
Note that strong moving average indicators always need to be accompanied by other analysis techniques. Use of multiple moving average strategies with a combination of other indicators and research through the market will guide decisions hence more likely to bring good outcomes to investments. This article has provided a starting point in the understanding and use of moving averages; keep digging deeper and fine-tune your knowledge to make them an essential part of your investment journey.
What is the difference between SMA and EMA?
The Simple Moving Average calculates the average of price data within a given period, allowing equal weighting for all data points. The Exponential Moving Average provides heavy emphasis on recent price data, making it more sensitive to change in the current price trends. The choice between SMA and EMA will vary with each investor and trader type.
How Reliable Are Moving Averages In Trading?
Moving averages are wonderful tools, but the reliability is dependent on market conditions and the strategy used in moving averages. In trending markets, they seem to work very well. In choppy or sideways markets, though, it is not reliable at all. Always use them with other indicators and analysis techniques.
Can moving averages be used for day trading?
Yes, moving averages can be used for day trading. This is when one analyzes the short-term price movements and comes up with possible entry and exit points. Day traders mainly use shorter-period MAs to capture quick price fluctuations; these are 5-day, 10-day, or 20-day MA.
What is the role of MACD in trading?
The Moving Average Convergence Divergence, or MACD, is a momentum oscillator that plots the relationship of two EMAs. This tool helps traders in detecting potential buy and sell signals, confirming trend reversals, and assessing the strength of a trend.
Why is the 200-day moving average significant?
The 200-day MA is a very well-known indicator for long-term trend analysis. It serves as a primary threshold for the general market direction. A price consistently trading above the 200-day MA typically suggests a bullish trend, while a price below suggests a bearish trend.
Discover investment portfolios that are designed for maximum returns at low risk.
Learn how we choose the right asset mix for your risk profile across all market conditions.
Get weekly market insights and facts right in your inbox
It depicts the actual and verifiable returns generated by the portfolios of SEBI registered entities. Live performance does not include any backtested data or claim and does not guarantee future returns.
By proceeding, you understand that investments are subjected to market risks and agree that returns shown on the platform were not used as an advertisement or promotion to influence your investment decisions.
"I was drawn to Wright Research due to its multi-factor approach. Their Balanced MFT is an excellent product."

By Prashant Sharma
CTO, Zydus
By signing up, you agree to our Terms and Privacy Policy
"I was drawn to Wright Research due to its multi-factor approach. Their Balanced MFT is an excellent product."

By Prashant Sharma
CTO, Zydus
Skip Password
By signing up, you agree to our Terms and Privacy Policy
"I was drawn to Wright Research due to its multi-factor approach. Their Balanced MFT is an excellent product."

By Prashant Sharma
CTO, Zydus
"I was drawn to Wright Research due to its multi-factor approach. Their Balanced MFT is an excellent product."

By Prashant Sharma
CTO, Zydus
Log in with Password →
By logging in, you agree to our Terms and Privacy Policy
"I was drawn to Wright Research due to its multi-factor approach. Their Balanced MFT is an excellent product."

By Prashant Sharma
CTO, Zydus
Log in with OTP →
By logging in, you agree to our Terms and Privacy Policy
"I was drawn to Wright Research due to its multi-factor approach. Their Balanced MFT is an excellent product."

By Prashant Sharma
CTO, Zydus
Answer these questions to get a personalized portfolio or skip to see trending portfolios.
Answer these questions to get a personalized portfolio or skip to see trending portfolios.
(You can choose multiple options)
Answer these questions to get a personalized portfolio or skip to see trending portfolios.
Answer these questions to get a personalized portfolio or skip to see trending portfolios.
Answer these questions to get a personalized portfolio or skip to see trending portfolios.
(You can choose multiple options)
Investor Profile Score
We've tailored Portfolio Management services for your profile.
View Recommended Portfolios Restart