Investing today is more complex than ever, requiring not just knowledge of financial instruments but also the ability to evaluate their performance effectively. While many metrics are available to assess investment growth, one particularly useful metric is the Compound Annual Growth Rate (CAGR). However, when it comes to evaluating smallcases , which involve periodic investments, XIRR (Extended Internal Rate of Return) often provides a more accurate picture.
Why XIRR Is Superior to CAGR for Smallcases
1. Handling Periodic Investments
CAGR is effective for single, lump-sum investments made at the beginning of a period. However, smallcases often involve periodic investments, such as monthly contributions, which CAGR cannot accurately account for. XIRR, on the other hand, is designed to handle multiple cash flows, considering both the timing and amount of each investment. This results in a more precise annualized rate of return.
2. Incorporating the Time Value of Money
The time value of money is a fundamental principle stating that money today is worth more than the same amount in the future due to its earning potential. XIRR incorporates this concept, recognizing the varying growth potential of each cash flow over time. This ensures that the returns calculation reflects the real growth or depreciation of your investments.
Difference Between XIRR and CAGR
Practical Example Showing XIRR v/s CAGR
Consider an investor who started with a ₹2 lakh investment in a Dividend – Smart Beta smallcase in July 2018, followed by monthly contributions of ₹20,000 until June 2023. Over these 61 months, the total investment would be ₹13,80,000, growing to ₹19,40,444. Calculating the absolute returns gives a 41% return, but this doesn't consider the timing of each ₹20,000 SIP. CAGR can't be used here due to the varying cash flows. Instead, XIRR, which accounts for all these investments and their timing, provides a more accurate return rate of 12.1%.
Why Is XIRR Important?
- Accuracy in Performance Measurement: XIRR gives a true representation of investment performance by factoring in the time aspect and separate cash flows, unlike CAGR.
- Consistency in Returns: By evaluating the annual growth rate and the stability of returns over time, XIRR helps in predicting future growth rates more reliably.
- Comparative Analysis: XIRR enables effective comparison of different smallcases, allowing investors to identify which portfolios have achieved higher growth rates in the past and make informed decisions about future investments.
Get high XIRR, trending quant smallcase strategies that are beating the stock market.
Subscribe Now
Steps to Calculate XIRR Manually
Calculating XIRR manually involves iterating to find the discount rate that sets the Net Present Value (NPV) of cash flows to zero. Here's a step-by-step guide on how you can do this manually, though it's typically more practical to use financial software or a calculator due to the complexity of the calculations.
1. List all Cash Flows and Dates:
2. Convert Dates to Year Fractions:
Calculate the time difference in years between each cash flow date and the first cash flow date. This can be done using the formula:

3. Estimate the Rate of Return:
Choose an initial guess for the rate of return (let's call it ‘r’).
4. Calculate the NPV:
Calculate the NPV of the cash flows using the chosen ‘r’. The formula for NPV is:
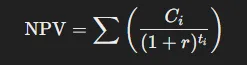
Where:
5. Iterate to Find the Correct Rate:
Adjust ‘r’ and recalculate the NPV until the NPV is as close to zero as possible. This iterative process can be done using methods like Newton-Raphson, but it's more practical to use a financial calculator, excel or software for this step due to its complexity.
Example of XIRR Calculation
Let's illustrate with a simplified example:
Initial Investment: -₹200,000 on 01/07/2018
Monthly Investments: -₹20,000 on the first of each subsequent month until 01/06/2023
Ending Value: ₹19,40,444 on 01/06/2023
Step 1: List Cash Flows and Dates
Step 2: Convert Dates to Year Fractions
Step 3: Estimate Rate of Return (r)
Let's start with an initial guess of ‘r’= 10% or 0.10.
Step 4: Calculate NPV
Using the NPV formula:
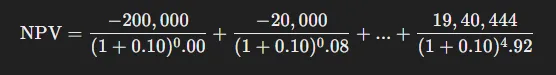
Perform this calculation for each cash flow. If the NPV is not close to zero, adjust ‘r’ and repeat.
Step 5: Iterate to Find Correct Rate
Adjust r incrementally and recalculate the NPV until it approaches zero. This iterative process can be cumbersome and is why tools like Excel's XIRR function or financial calculators are commonly used.
Using Excel to Calculate XIRR
In Excel, you can use the XIRR function to simplify this process:
List your cash flows in one column.
List the corresponding dates in another column.
Use the formula = XIRR (cash_flows, dates) to calculate the XIRR directly.
List all Cash Flows and Dates:
Create a column for cash flows and enter all cash flows (negative for investments, positive for withdrawals).
Create a corresponding column for the dates of each cash flow.
Use the XIRR Function:
In a new cell, use the XIRR function to calculate the XIRR = XIRR(cash_flows, dates). Replace cash_flows with the range of cells containing the cash flow values and dates with the range of cells containing the corresponding dates.
Example of XIRR Calculation Using Excel:
Step 1: List Cash Flows and Dates
A1: Date | B1: Cash Flow
A2: 01/07/2018 | B2: -200000
A3: 01/08/2018 | B3: -20000
...
A63: 01/06/2023| B63: -20000
A64: 01/06/2023| B64: 1940444
Step 2: Use the XIRR Function
C1: =XIRR(B2:B64, A2:A64)
Result in C1 will be the XIRR.
Calculating CAGR in Excel:
Initial Investment Date: A2 (e.g., 01/07/2018)
Initial Investment Value: B2 (e.g., -200000)
Ending Value Date: A64 (e.g., 01/06/2023)
Ending Value: B64 (e.g., 1940444)
Number of Years: =(A64 - A2)/365 in a separate cell, say C1.
CAGR Calculation: =(B64 / B2)^(1/C1) - 1
Tips for using XIRR in Excel:
Ensure that all cash flow entries are correctly signed (negative for outflows and positive for inflows).
Dates should be in Excel date format.
Use the formula auditing tools in Excel to ensure the ranges and calculations are correct.
Get high XIRR, trending quant smallcase strategies that are beating the stock market.
Subscribe Now
Conclusion
While CAGR is useful for evaluating single, lump-sum investments, XIRR is essential for a comprehensive analysis of periodic investments like those in smallcases. By incorporating the time value of money and recognizing the impact of each cash flow, XIRR provides a clearer, more accurate picture of investment performance. For investors looking to evaluate their smallcase portfolios, tracking XIRR is the superior method to understand real returns and make informed investment decisions.
Read these comprehensive Smallcase How To Guides to understand all you need to know about Smallcases:
Understanding What is Smallcase and How Does it Work?
Features & Benefits of Investing in Smallcases
8 Things To Check Before Investing In A Smallcase Portfolio
Should You Invest In Smallcases? Are Smallcases a Good Investment?
Understanding the Importance of Rebalancing Your Smallcase Investments
How to Use Existing Demat Accounts to Invest in Smallcases
How To Choose Between Different Types Of Smallcases
Understanding Smallcase Returns, Lock-In Periods, and Minimum Investments
Understanding Smallcase Fees, Charges, and Taxes
How to start SIPs with Smallcase?
How Many Smallcases Should You Have in Your Portfolio?
Where can I view my saved smallcases?
How to Evaluate Smallcase Performance Using CAGR & XIRR
Why Use XIRR Instead of CAGR To Evaluate Your Smallcases Performance
How to Reinvest in a Smallcase You Had Once Exited From
How to Partially Exit or Sell Individual Stocks in Smallcases